It is a tru-ism these days that active managers tend to underperform the index. Cullen Roche recently wrote a blog post about the challenges of active management compared to indexing. The main reason he cited is active managers hold too much cash:
If we look at the history of the stock market we know that stocks rise the vast majority of the time – generally somewhere between 70-80% of the time. So, any active investor who isn’t 100% fully invested is likely to underperform a highly correlated index after taxes and fees. The data on this is pretty conclusive and the basic logic behind it confirms it. The flip side, of course, is that most active managers are holding cash positions or hedging portfolios at times during the cycle so they’re never 100% invested to begin with. So, when we see studies that claim active mangers underperform the index we should not be ONE BIT surprised.
Roche is correct. Active managers, even if they have a mandate to be fully invested, often hold 2-5% cash in their portfolio for liquidity purposes as it is operationally difficult to hold 0% cash. So imagine that if you are holding 5% cash and the market went up 1% - you just underperformed by 5 basis points because of your cash holdings. Accumulate that effect over over the years and it adds up.
Size effect on active performance
I also want to point out another effect on active performance, the influence of stock weights in the index. The S&P 500 is an index of 500 stocks with different weights. The larger companies, such as Apple Inc (NASDAQ:AAPL) and Exxon Mobil Corporation (NYSE:XOM), have larger weights by virtual of their size and the smaller ones have much smaller weights.
Now imagine that you are an active stockpicker manager with an S&P 500 mandate. You will hold a portfolio of 100 stocks. For the simplicity of this exercise, you will only pick stocks that are members of the index. With virtually all investment processes, statistically your portfolio will have a smaller capitalization profile than the index.
Read that last italicized sentence over and think about it. If you threw darts to pick your stocks and then formed an equal-weighted portfolio, i.e. 100 stocks with 1% weights, you will tend to underweight the large caps (e.g. AAPL and XOM) and overweight the small caps within your universe. In fact, it would be difficult to construct a weighting methodology where you pick 100 random stocks out of 500 that would have a larger cap profile than the index. That's because, statistically, the larger cap names have only a 1 in 5 chance of being picked to be in the portfolio. I recognize that stock picking managers do not pick stocks randomly, but few stock picking managers have a systematic bias towards large cap stocks.
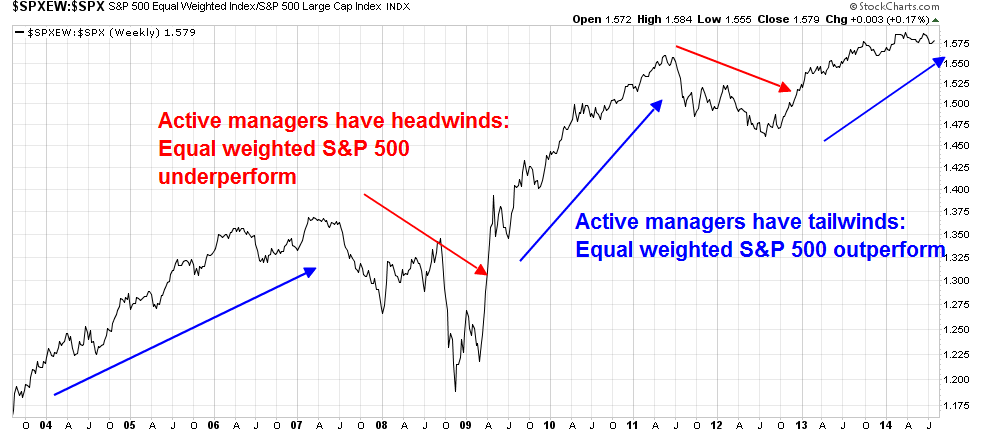
Here is the punch line: When large caps outperform, active managers will face headwinds in their returns. The chart below shows the relative performance of the equal-weighted S&P 500 compared to the S&P 500. When the line is rising and steep, active managers will tend to perform better. When the line is falling, they do much worse than the index.

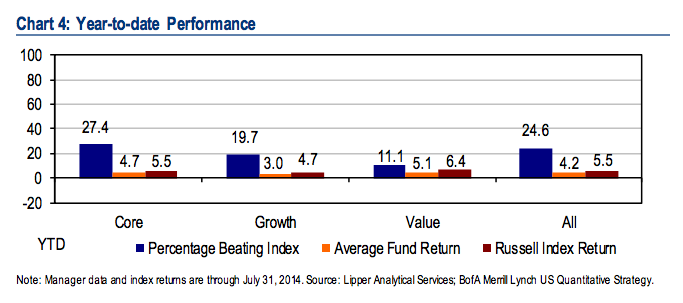
Savita Subramanian of BoAML (via Josh Brown) recently noted that only 27% of core managers beat their benchmark on a YTD basis. You will note that in the above chart, the equal weighted to cap weighted relative performance chart flattened out.

None of the information or opinions expressed in this blog constitutes a solicitation for the purchase or sale of any security or other instrument. Nothing in this article constitutes investment advice and any recommendations that may be contained herein have not been based upon a consideration of the investment objectives, financial situation or particular needs of any specific recipient. Any purchase or sale activity in any securities or other instrument should be based upon your own analysis and conclusions. Past performance is not indicative of future results. Either Qwest or Mr. Hui may hold or control long or short positions in the securities or instruments mentioned.
