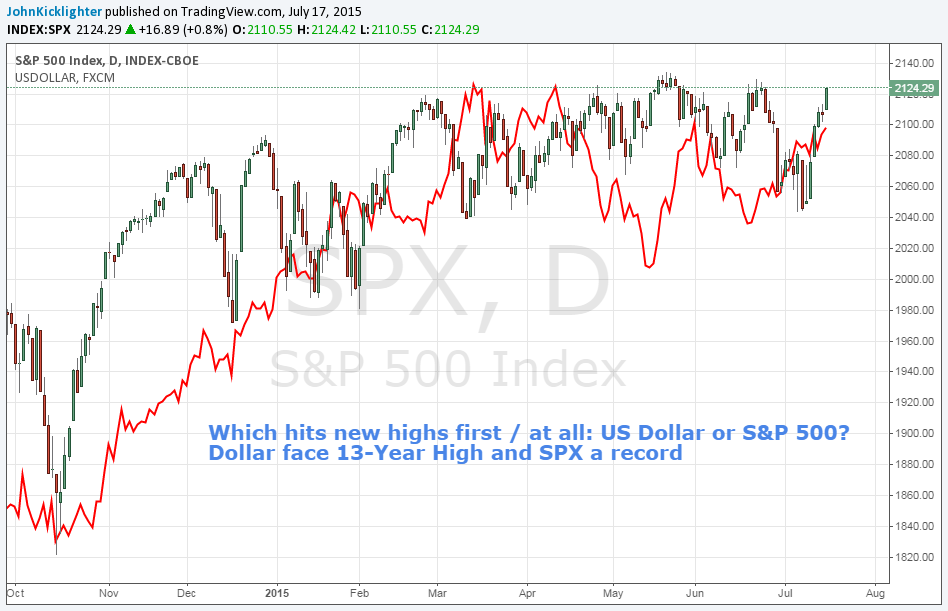
The S&P 500 is a standard bearer for global equity markets while the US dollar is the world’s most liquid currency. Though they both represent the US financial system, they frequently take up opposing market views on the basis of investor sentiment. The elements that can forge gains for the currency have in the past undermined the stock benchmark and vice versa. So, as these two move closer and closer to their respective highs – the S&P 500 approaching another record and the dollar a 12-year highs – which has the fundamental backing to push to new heights and further feed the next bullish phase?
The Dollar Can Benefit from Disparate Outcomes
For the Greenback, there is a fundamental argument to be made regardless of whether which direction risk trends take or should the Fed pursue the tightening bias it has tried to acclimate the market to. Should we follow a path of risk appetite trends, the implications of a first-mover status for the US to lead the world back to a tightening bias are clear. In the graph below, we find the Federal Reserve is perceived as the most hawkish, major central bank. Even though the benchmark lending rate is near zero, real rates are significantly more appealing compared to regions where rates are being actively cut or policy groups are pursuing aggressive stimulus programs.
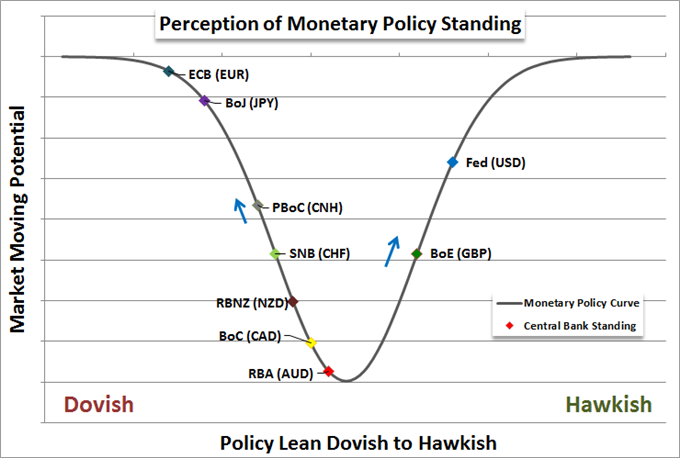
Alternatively, a shift towards risk aversion would confer an even greater appeal to the currency. In a flight to safety, the Dollar’s standing as the most liquid currency and heavily used reserve makes it a haven when investors do not have the luxury to debate the finer points of risk and reward for lesser counterparts. That is a distinct contrast to the S&P 500, which as we can see below is heavily dependent on an appetite for higher return and diminished sense of uncertainty/volatility.

Equities’ Motivation Increasingly Shrinking
It is hard to argue with the progress than US equities have forged. The six years of recovery since the Great Financial Crisis ending in early 2009 has seen the benchmark S&P 500 climb over 200 percent. That said, the circumstances behind the climb have shifted over time. The return of sidelined capital and general economic growth transitioned into an expectation of central bank supported returns and eventually into complacency (a habit of buoyancy).
We do not need to see investor confidence ravaged for equities to start losing ground. We can see a range of holes have already appeared and are starting to challenge the confidence that once seemed unflappable.
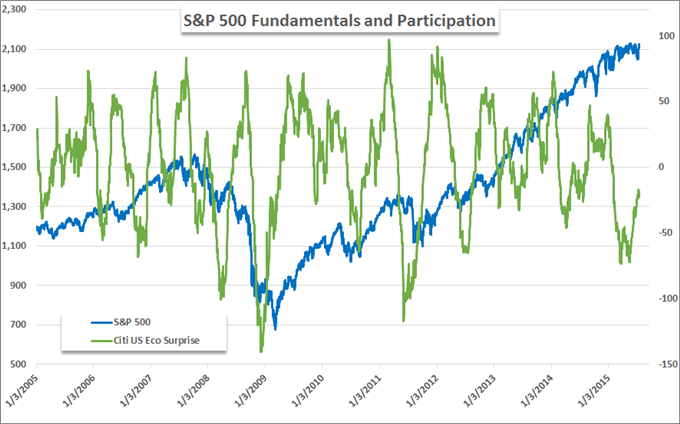
In the chart above, we have a sense of economic strength as a source of capital market value. Measures like GDP and employment have leveled out, but this is a measure of the ‘surprise value’ in key economic data that can further cheer the masses. There has been a steady decline in the exuberance the data has been able to muster over the years.
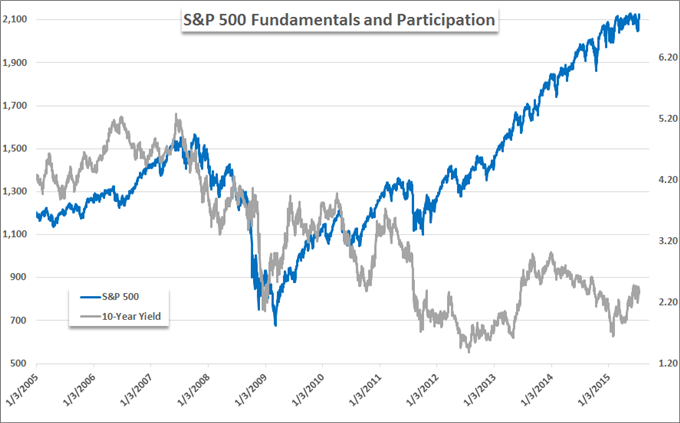
Critical to investor appetite is the expectation of strong returns. That has been something that has proven incredibly uneven through the past three-to-four years. While capital gains have offered remarkable paper returns for the buy-and-hold (though we are generally flat through 2015), the ‘income’ has severely lagged the benchmarks. Above, the 10-Year Treasury yield is a good baseline for market rates.
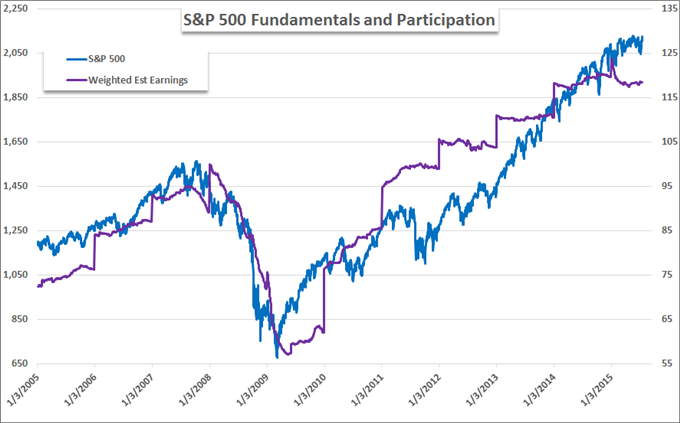
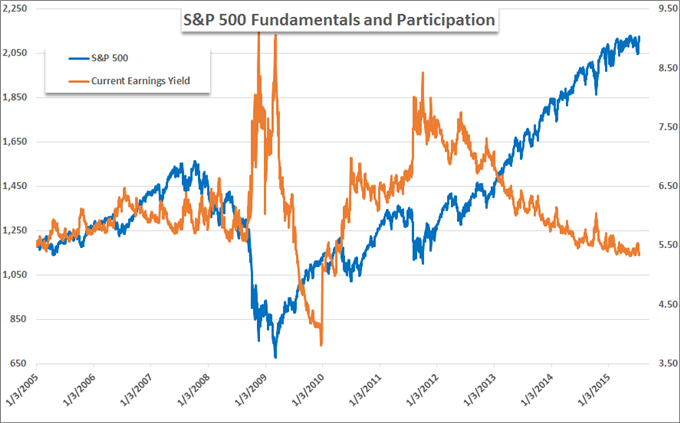
Most fundamental bulls have championed the earnings view as a fount of further gains. Firms have generally proven quite adept at besting market forecasts on a quarterly basis, however, the pace of growth in returns has certainly slowed. It is even expected that they may turn lower for the first time in years.
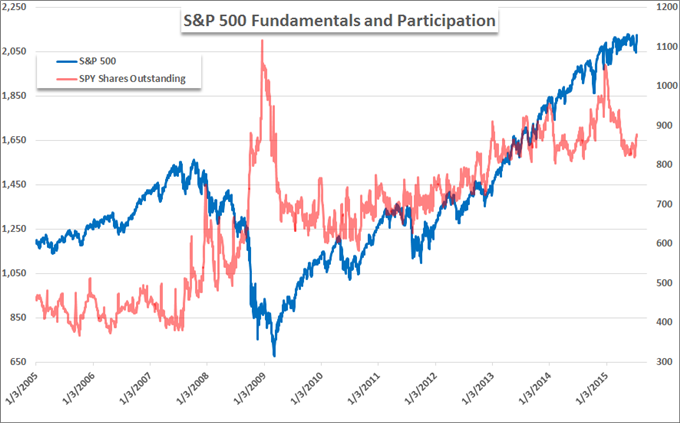
Speculative appetite and market saturation is another area of uncertainty. We have seen volume behind the spot and futures S&P 500 drop steadily over the years. Open interest – a measure of participant – has also flagged. For the ARCA:SPY ETF, we have seen interest in this most recent thrust meaningfully drop.
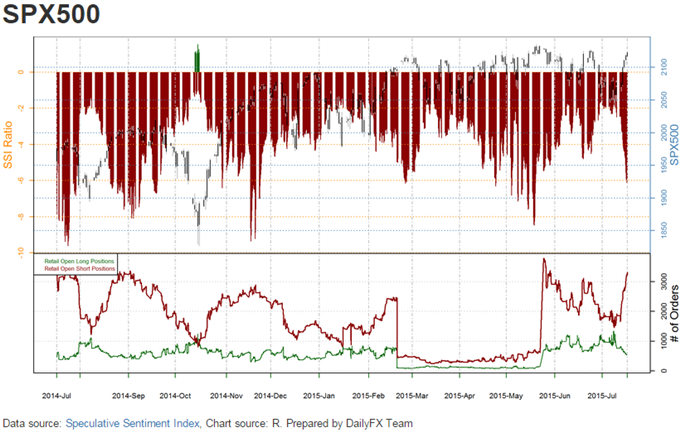
In the above chart, we can see the retail speculative trader has heavily positioned for an expected turn. FXCM’s Speculative Sentiment Index shows that there are nearly six times the number of short positions for every one long. While there have been more extreme readings in the past, maturity increasingly factors in.

