Back during the Great Financial Crisis, I’d get a panicked call from my grandma at least once a month, asking if the stock market crash would ever end and whether she should take her money out to bury in the proverbial backyard. In contrast, her calls over the last five years have filled with updates on my little cousins and distant relatives that had passed away. Wednesday, though, she sent me a text (she’s surprisingly technologically savvy for 85 years old) asking what she should do with her stocks.
At times, I’ve thought that her calls may represent a reliable contrarian indicator for the market, but rather than trading based on an individual anecdote, the best thing traders can do is take a step back and evaluate the market objectively.
Precursors
As we noted last week (see “8 Signs Keeping S&P 500 Bulls Awake” for more), the precursors for this violent drop have been in place for weeks. Therefore, it’s not surprising that today’s collapse, which has stretched to as much as 450 points on the Dow Jones Industrial Average and over 50 points on the S&P 500 at one point, comes without a specific bearish catalyst.
Some analysts have attributed the drop to the series of weak US economic reports we saw Wednesday morning, while others have pointed falling oil prices, low inflation in the Eurozone, and even forced hedge fund selling on the back of a cancelled merger between AbbVie (NYSE:ABBV) and Shire (NASDAQ:SHPG). Regardless of the specific catalyst, US markets have now experienced their first 10% peak-to-trough “correction” in over 700 days.
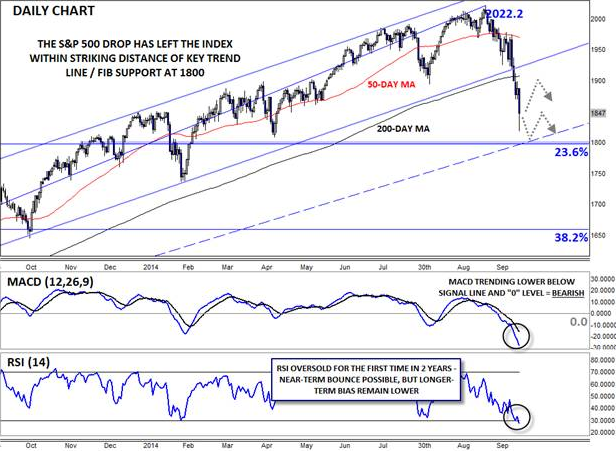
At this point, the S&P 500 has seen a substantial amount of technical damage. The index easily sliced through the bottom of its 2-year bullish channel, as well as its 200-day MA near 1905. Meanwhile, the secondary indicators are both looking more pessimistic than they have in years; the MACD is at its lowest level since 2011, while the RSI indicator is back in oversold territory for the first time in over two years. While the oversold RSI reading could lead to a short-term bounce, it is a very bearish sign from a longer-term perspective. In healthy markets, the indicator typically finds support ahead of the 30 level, like we’ve seen over the past two years. The big drops in the RSI and MACD indicators suggest that the “character” of the market has changed, and regardless of what happens moving forward, a return to the happy-go-lucky uptrend we’ve seen over the past few years is unlikely.
Moving forward, the next critical level of support to watch on the S&P 500 sits around 1800; this level represents the confluence of the bullish trend line off the 2011 low (on an arithmetic-scale chart), as well as the 23.6% Fibonacci retracement of the entire rally off the 2011 low. The aforementioned oversold RSI could lead to a short-term bounce off that floor, though the path of least resistance for the market will remain lower as long as the index stays below its 200-day moving average near 1900… much to the chagrin of grandmother and other investors.

Source: FOREX.com
For more intraday analysis and market updates, follow us on twitter (@MWellerFX and @FOREXcom).
Best regards,
