That’s the big question, isn’t it after all?
“But there’s no inflation!” say those who accept official numbers, whose fund performance requires to look as good as possible and so on. “Au contraire!” say those who actually buy their food energy and don’t get paid to affect blindness, “It’s running at 5-10-15 (pick your percentage) !”
What can we do with this problem?
Here is one analyst’s quirky view....
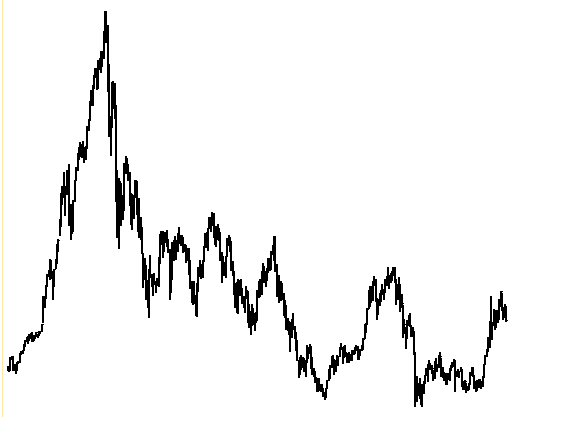
That’s the Nikkei 225 above, so it is, all 30+ years showing the final months of the Japanese bull, and the lost decade ... uh oh ... the lost three decades.
Now let’s have a look at the S&P 500 which is surely totally different from the sorry tale of Japanese stocks shown above. Here it is:
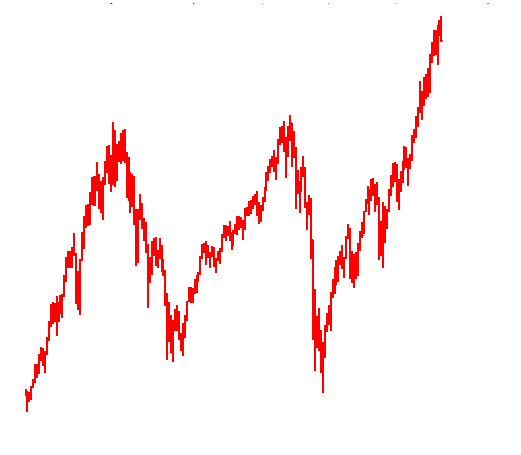
It’s shown in red for clarity later.
Yep, just look at that HUGE bull market in the US! Totally different from Japan. Right?
Well how about this for a comparison between the two bear markets?
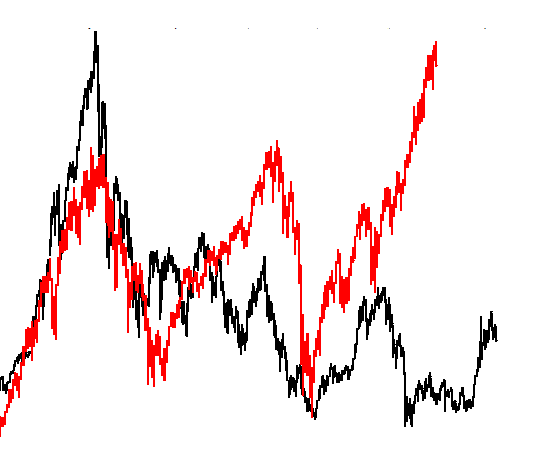
The relative more bullish US bear is clear, compared to the decline in Japanese stocks.
The price and time axis are not shown because I played around with them a bit. You see the US high came rather later than the Japanese high so December 1989 (Japan) is lined up beside March 2000 (US). I placed 13 years of S&P on top of 30 years of Nikkei, so this is about the character of the period rather than a precise day to day, or week to week comparison. It is to be looked at for similarity of form only, as the action-reaction sequence of Japan was at a slower rate than that of the US under Ben Bernanke, as I'll now explain.
I detect a sort of similarity, not exact of course, but nonetheless the larger swings seem to be present in both indices. The notable differences are the smaller swings vary, and the Nikkei trended down more strongly than the S&P which went sideways for the lost decade.
Mr. Ben Bernanke was a student of the 1930’s depression and he didn’t want deflation, so he got printing fresh money very quickly indeed, to replace the credit which evaporated during this period. The Japanese on the other hand stuck with a stronger Yen policy than the US did, and really only began to print fresh money pretty late in their depression.
So this means that the US index is being priced in a weakening dollar. Hmmm. If I detrend by using the CPI, I use a tainted inflation data in my work due to all the "special adjustments" which subvert this index from it's purpose. I could use the CRB to detrend, but well, you know, western Central Banks and commodity prices have this little thing going between each other that nobody below the level of TBTF CEO is supposed to talk about, and then only behind closed doors while drinking champagne and eating caviar!
“Oh well”, says I to myself “What about matching the two stock indices up and seeing how much adjustment it takes to do make that work?”
So I detrended the S&P until it lined up with the Nikkei over the earlier period. It took at 55% decrease in the SPX to do this, which is over a 13 year period which would be about three and a half percent per year of inflation difference between the two countries.
Here is the result in the S&P price chart for the past 15 years:
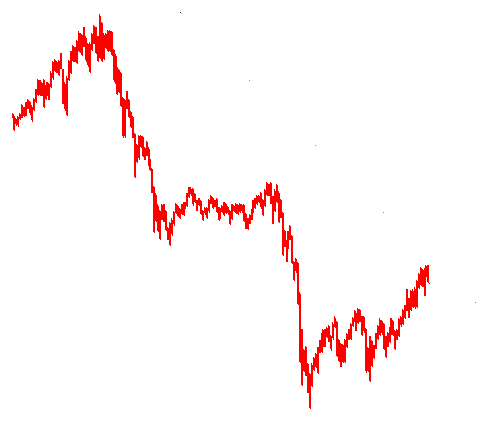
It looks worse this way by quite a bit, eh? But that’s a slanted or skewed display of the S&P.
Next I overlaid it on the Nikkei ...
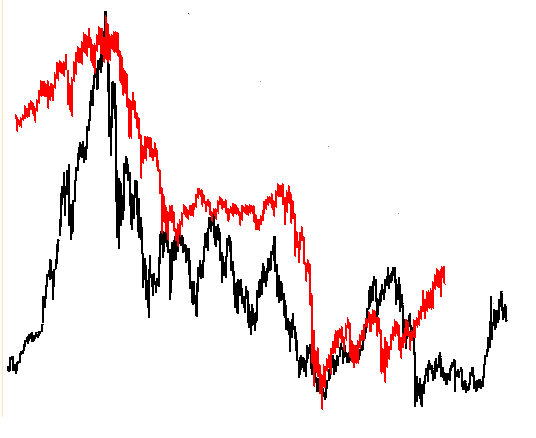
... and a certain correlation now emerges visually. So maybe those central Banks are not so different from each other after all. The recent upturn in the Nikkei is representative of the introduction of Abenomics, or “QE” which used to be called “money printing”. I guess Bernanke would say that the 55% extra in US stocks is all the difference in the world, and he deserves credit for that. Maybe not from those who are on the hook for it though. But he took charge of a dire situation, and we are all still here, for whatever it's worth.
Given the correlation visible after my adjustment of the data, I would say it is clear that neither the US nor Japanese stock markets are out of their downtrend, after inflation is adjusted. They may have stopped falling in real inflation adjusted terms, but as stocks rise, the currency they are denominated in falls at the same time. So the benefit which remains is due to leverage of currency within the stocks, or the corporations themselves, and I suggest, (but without proof) that this leverage will someday unwind.
So if they are still in a downtrend in real terms, is there any chance that QE, Abenomics, or money printing will cease in the short term? I doubt it. There is a problem. It is now abundantly clear that money printing does not work to end depressions. How the central bank heads will overcome this remains to be seen, but they represent the financial services industry’s interests whether that is known or not, and since deflation is disastrous to fractionally leverage banks survival prospects, and since they are very aware of that, they will attempt to justify continued money printing as long as they can in my view.
But they won’t be allowed to print as freely as before. The days of trillions of easy money for the elite to go gangbusters buying up everything is sight are coming to an end. That leaves on the table one option: a continuance of money printing, but in reduced quantity, which seems to now be called “tapering”, but to me is just money printing at a reduced rate.
I assume the recipients of the money still to be created may be vetted somewhat more than during the past decade, and a certain small element of fairness will arrive, after all the politicians can see their popularity ratings plummet and are not so stupid as to omit a reaction to this. They have alternatives: war for increased control of voting public, or fair policies as an alternative defusing mechanism. We should expect a mix of both of these, I think.
As for stocks? The S&P is entering it’s third rotation correction since the 2009 low. The 2009 low saw a switch of smart money from bonds to bond-like dividend paying stocks and utilities. The first rotation, was a correction between April 2010 and November 2011, and this saw cyclicals absorb the capital coming out of the then more expensive defensive dividend paying stocks. The cyclicals then ran up. The second rotation was a minor correction in Q2 2013 saw mid caps take up the running and wider indices than the Dow begin to outperform. It’s likely that the correction we are seeing take place at the moment, which still has a couple of weeks to go, will see smart money leave in quantity and the public enter whether as individuals, or in some state mandated form, to take ownership of those stocks currently being distributed to smaller hands.
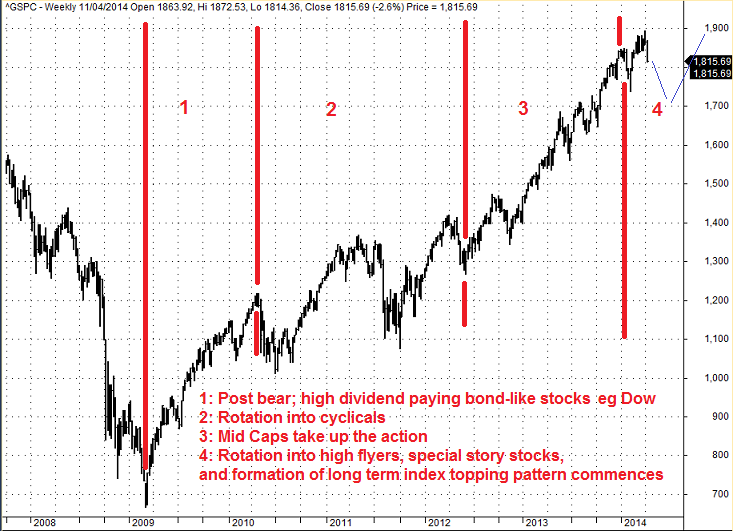
So how long can it last? Assuming it picks up after the present correction, or rotation, the final wave up could last a year if the public get lured in and push it. A more equitable disbursement of money printing to the people rather than the elite seems to be likely and that is a material factor if it works out. I have periods of July 2015 up to January 2016 which I am very interested in for this process. It seems a long way away, but that's the trouble with life, we crawl through big events one day at a time.
The smart money is not going to wish to play in the market much after mid 2014. Where will it go next? I believe rising soft commodities are already showing the early footprints of this invisible elephant, and there will be a rotation from softs to hard commodities. For now the precious metals are completing their bases and testing lows to demonstrate (or not) that their bear market is ending/ended and softs look good during Q1 2014. When softs are higher and no longer offer exceptional value, and alternatives are required to rotate into as the public spends their money and inflation manifests itself at the retail level, the time for PM markets will have arrived.
Argentus Maximus
The author posts daily commentary on the gold and silver markets in the TFMR forum: The Setup For The Big Trade.
This is not investment advice, but rather educational material for discussion, and entertainment. Readers are expected to obtain professional advice from a qualified member of the financial services industry before risking their assets in the financial markets. All the above ideas and discussion should be prefaced with the words: "in my humble opinion and as best I can tell from what I see at the moment ...."
