• What the US employment report means: Non-farm payrolls for November came in above expectations, while the figure for the previous month was also revised upwards. The market consensus is that this was the last piece of data the Fed needed to hike rates heading into its December meeting, with many market participants describing it as a “done deal.” Now the market focus will shift on the pace of subsequent rate hikes, which are expected to depend on confidence in the path of inflation.
• Today’s highlights: The German industrial production for October has been already released. The figure came 0.2% mom, below expectations of a 0.8% mom rise. October’s better-than-expected factory orders, as well as the strong unemployment rate and manufacturing PMI for November were providing indicators that the Eurozone’s growth engine is regaining momentum during the final quarter of the year. However, the below consensus industrial output did not support that notion as much as we expected. Anyhow, there was no major reaction from the euro at the release.
• We have one speaker on Monday’s agenda: St Louis Fed President James Bullard speaks.
• As for the rest of the week, on Tuesday, during the Asian morning, China’s trade surplus is expected to have increased in November. However, that’s only because imports are expected to fall at a faster pace than exports. This could hurt AUD and NZD, since Australia and New Zealand are heavily dependent on exports to China.
• During the European day, Eurozone’s final Q3 GDP is forecast to confirm the preliminary estimate and to show that Eurozone’s economy expanded by only 0.3% qoq. Therefore, the market reaction could be minimal at this release, unless we have a huge revision.
• From the UK, we get industrial production for October. Expectations are for the industrial output to have risen 0.1% mom, a rebound from September’s 0.2% decline. Given that the construction and manufacturing PMIs for the same month were encouraging, although they disappointed the following month, we see the likelihood for a strong industrial production figure as well. This could support GBP, at least temporarily.
• On Wednesday, we get China’s CPI and PPI data for November. The CPI is expected to have accelerated to 1.4% yoy from 1.3% yoy, while the PPI rate is expected to have remained unchanged. Inflation may have slightly sped up, but producers’ prices fell at the same pace as the previous month which is the worst since the global financial crisis. This could reinforce expectations for the PBoC to release more stimulus in the coming months.
• The Reserve Bank of New Zealand will hold its monetary policy meeting at the end of the day. After leaving the rate unchanged in its October meeting, the Bank warned that it may need to cut rates to offset the deflationary impact of the stronger currency. Followings signs that inflationary pressures have slowed somewhat, and given the NZD has been appreciating recently, expectations are for a 25bps rate cut, which could put downward pressure on the kiwi.
• On Thursday, during the Asian morning, Australia’s employment report for November is coming out. The unemployment rate is forecast to have increased to 6.0% from 5.9%, while the net change in employment is expected to show a decline of 10k, after an increase of 58.6k in October. This stands in contrast with the positive outlook expressed by the RBA in their latest report, which stated that conditions in the labor market have continued to improve. Deterioration in the country’s employment could weaken AUD.
• During the European day, the main event will be the Bank of England monetary policy meeting. No change in policy is expected while consensus is that the vote will once again be split 8-1 with Ian McCafferty to maintain his call for a rate rise. The minutes of the meeting are released at the same time as the meeting, which makes meeting days more interesting than before, as we will receive additional insights about members’ views on economic outlook and future decisions. The Bank’s Governor Mark Carney, has stated that the more effective the Financial Policy Committee is in stabilizing the economy, the easier it is for monetary policy to do its job, which is to achieve the inflation target. With the UK’s inflation rate currently close to zero, compared with the BoE’s target of 2%, the Monetary Policy Committee has valid reason to want to keep rates low, in accordance with the Governor’s statement.
• The Swiss National Bank also holds its policy meeting during the day. Since the ECB’s new round of stimulus fell well short of expectations and pushed the franc 1.2% down against the euro, we expect that the SNB will feel no immediate pressure to act at this meeting. Market and our expectations are for the Bank to keep its policy unchanged at this meeting, despite inflation remaining well below the Bank’s target and despite the unwanted boost in the franc against all the other G10 currencies except the euro, following the ECB’s decision. We believe that intervention in the currency market could still be the preferred instrument for the SNB to manage its currency, at least for now.
• Finally on Friday, the US retail sales for November are due to be released. The indicator is expected to have accelerated, which could suggest an increase in the US demand during the final quarter of the year and thus could support the USD.
The Market
EUR/USD retreats after strong US employment data
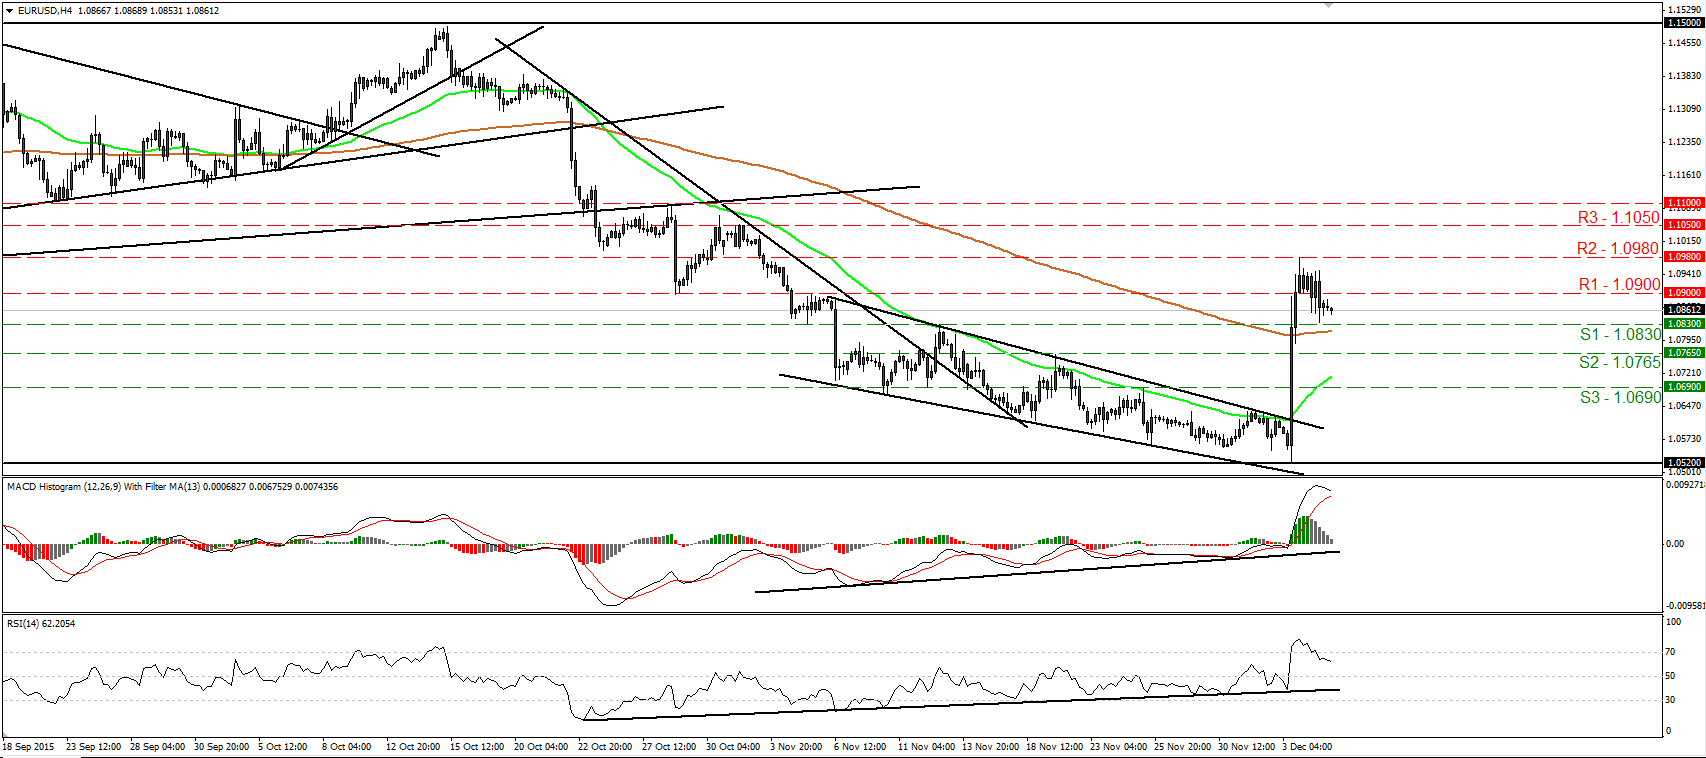
• EUR/USD traded lower on Friday amid a strong US jobs report and following comments by ECB President Draghi that the Bank could employ further stimulus measures if needed. The pair dipped below the 1.0900 (R1) line and hit our next support of 1.0830 (S1). The astonishing 500-pip rally on Thursday has turned the short-term picture positive in my view, but I still see signs that the pair could continue its setback for a while. The RSI exited its above-70 zone and is now pointing south, while the MACD, although at extreme positive levels, has topped and could fall below its signal line soon. A clear move below 1.0830 (S1) is likely to confirm the extension of the current pullback and could pave the way for the next support hurdle of 1.0765 (S2). Switching to the daily chart, I see that the pair is trading back above 1.0800, the lower bound of the range it had been trading from the last days of April until the 6th of November. As a result, although I believe the short-term picture has turned positive, I prefer to take a neutral stance as far as the overall outlook of EUR/USD is concerned.
• Support: 1.0830 (S1), 1.0765 (S2), 1.0690 (S3)
• Resistance: 1.0900 (R1), 1.0980 (R2), 1.1050 (R3)
GBP/USD trades in a consolidative manner
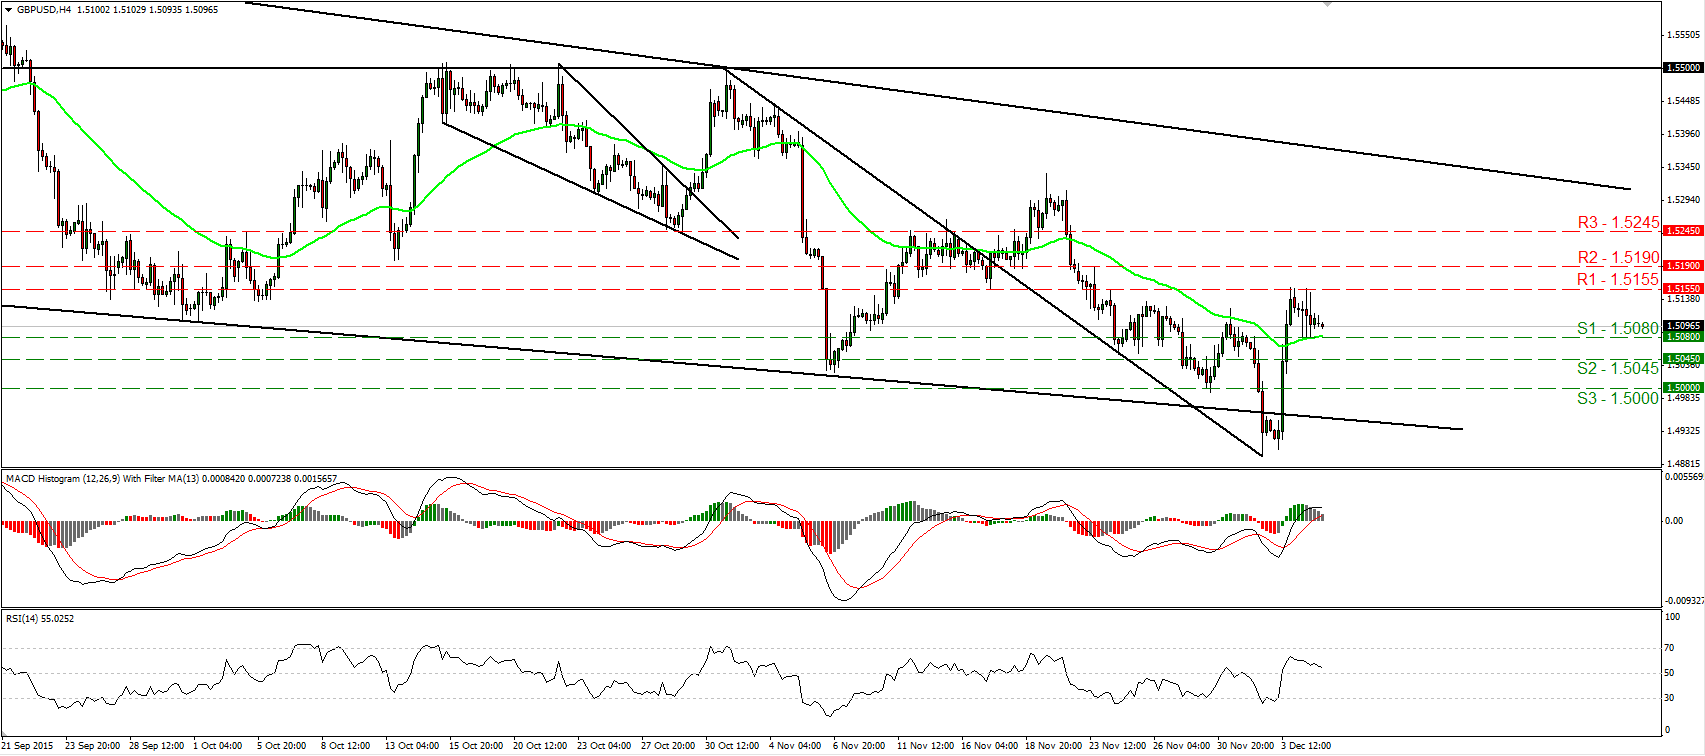
• GBP/USD traded in a consolidative manner on Friday, staying between the support of 1.5080 (S1) and the resistance of 1.5155 (R1). On Thursday the pair printed a higher high on the 4-hour chart, which has turned the short-term picture cautiously positive. However, taking a look at our momentum indicators, I see signs that a retreat could be in the works before and if the bulls decide to shoot again. The RSI hit resistance below its 70 line and is now headed towards its 50 line, while the MACD shows signs of topping slightly above its zero line. A break below the 1.5080 (S1) line is likely to confirm the case and perhaps challenge the 1.5045 (S2) line. On the daily chart, the price structure remains of lower peaks and lower troughs. What is more, the rate is trading below the 80-day exponential moving average, which has turned down. Therefore, I still consider the longer-term trend to be negative and I would treat the recent recovery or any extensions of it as a corrective phase of that medium-term down path.
• Support: 1.5080 (S1), 1.5045 (S2), 1.5000 (S3)
• Resistance: 1.5155 (R1), 1.5190 (R2), 1.5245 (R3)
USD/JPY looks to be headed for another test at 123.75
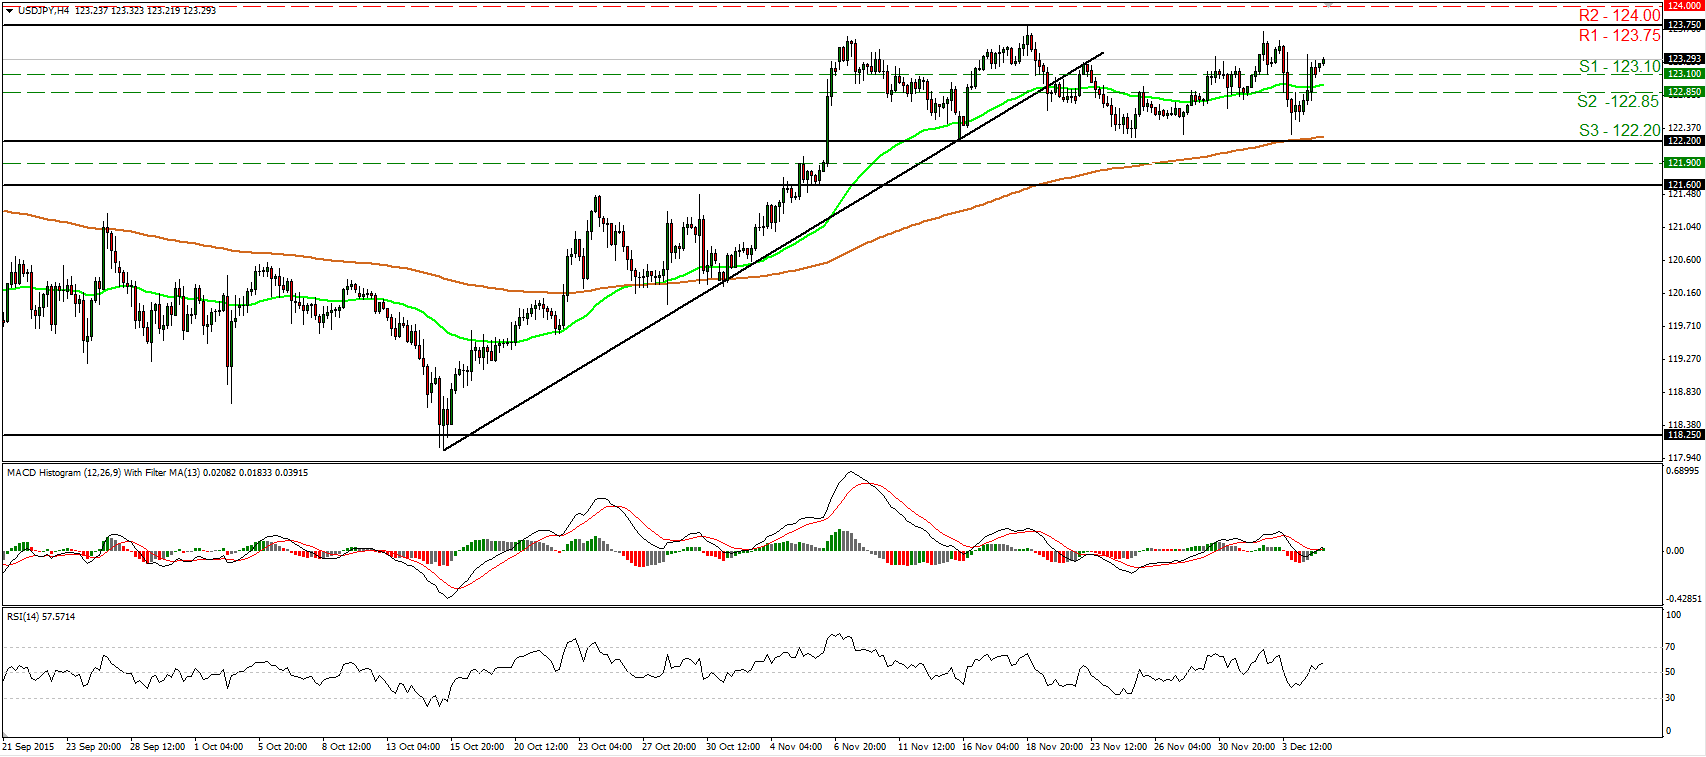
• USD/JPY traded higher after it hit support slightly above the key support zone of 122.20 (S3). Today, during the early European morning, the rate stands above the 123.10 (S1) line and looks to be headed for another test near the 123.75 (R1) resistance territory. The pair has been trading between that resistance obstacle and the key support area of 122.20 (S3) since the 6th of November. As a result, I would consider the short-term path of this pair to be sideways for now. Our short-term oscillators confirm the recent positive move and corroborate my view that we are likely to see another test near the upper bound of the aforementioned sideways range. The RSI emerged above its 50 line and is pointing up, while the MACD has bottomed slightly below zero, turned positive, and crossed above its trigger line. As for the broader trend, the break above 121.60 on the 5th of November has turned the longer-term picture back positive. However, I would like to see a clear move above the 124.00 (R2) resistance zone before I get more confident on larger bullish extensions.
• Support: 123.20 (S1), 122.65 (S2), 122.20 (S3)
• Resistance: 123.75 (R1), 124.00 (R2), 124.60 (R3)
Gold rebounds and hits 1065
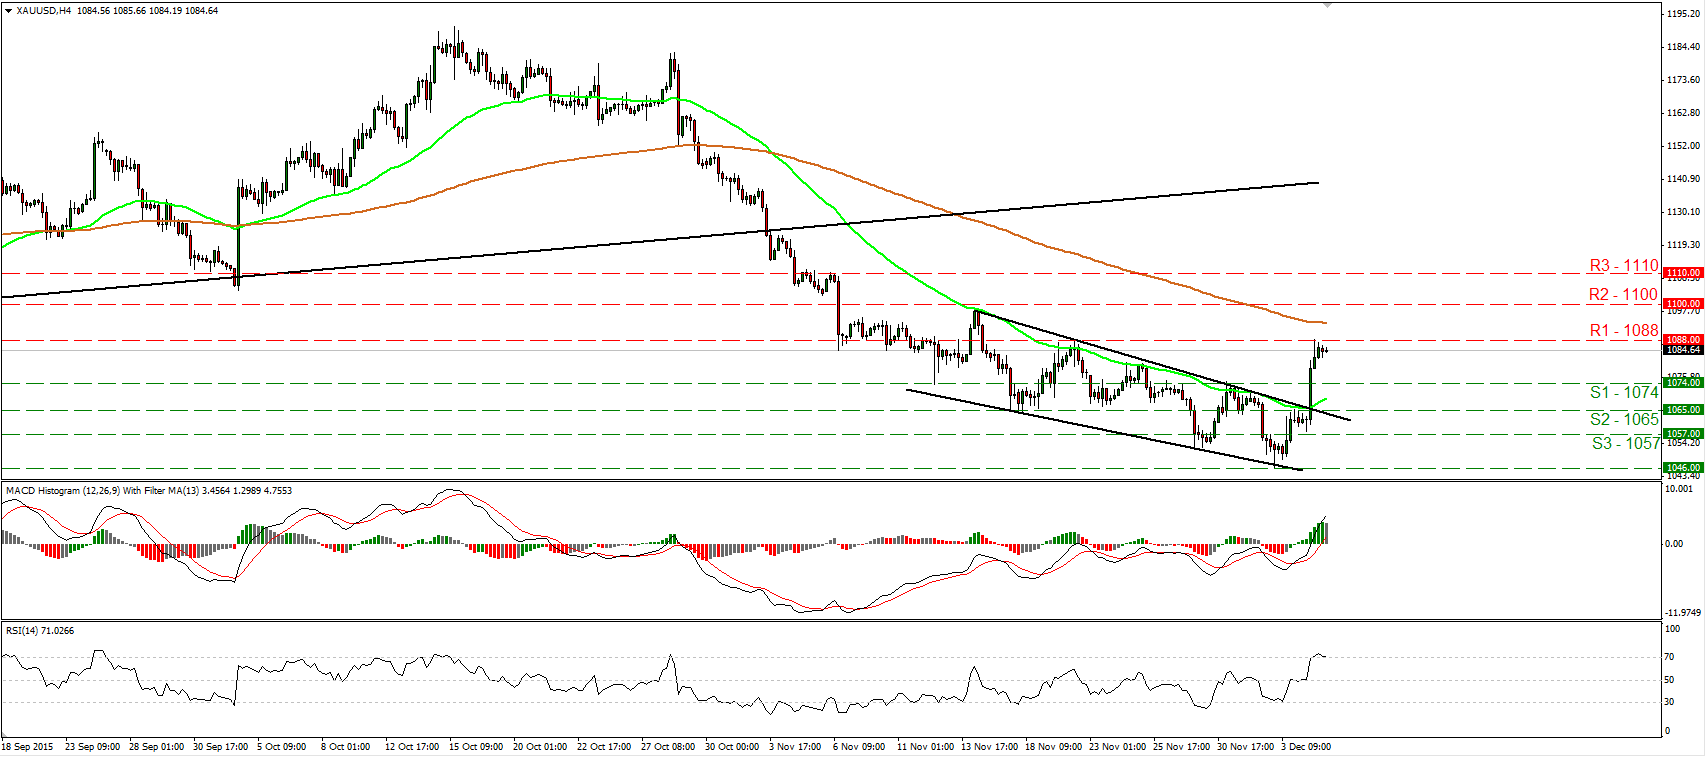
• Gold surged on Friday, breaking above the downtrend line taken from the peak of the 16th of November. The rally brought the metal above the resistance (now turned into support) barrier of 1074 (S1) and it was stopped by the 1088 (R1) hurdle, defined by the peak of the 20th of November. The break above the aforementioned trend line has turned the near-term picture somewhat positive in my view and therefore, I would expect a clear break above 1088 (R1) to open the way for the psychological zone of 1100 (R2). Our short-term oscillators detect positive momentum and support the notion. The RSI emerged above its 70 line, while the MACD stands above both its zero and trigger lines, pointing north. Nevertheless, the fact that the RSI has topped and looks able to move back below 70 makes me believe that a minor pullback could be looming before the next positive leg. On the daily chart, I see that the plunge below the upside support line taken from the low of the 20th of July has shifted the medium-term outlook to the downside. As a result, I believe that the metal is poised to continue its down road in the foreseeable future and I would treat the recent rally or any extensions of it as a corrective phase for now.
• Support: 1074 (S1), 1065 (S2), 1057 (S3)
• Resistance: 1088 (R1), 1100 (R2), 1110 (R3)
WTI falls below 40.00
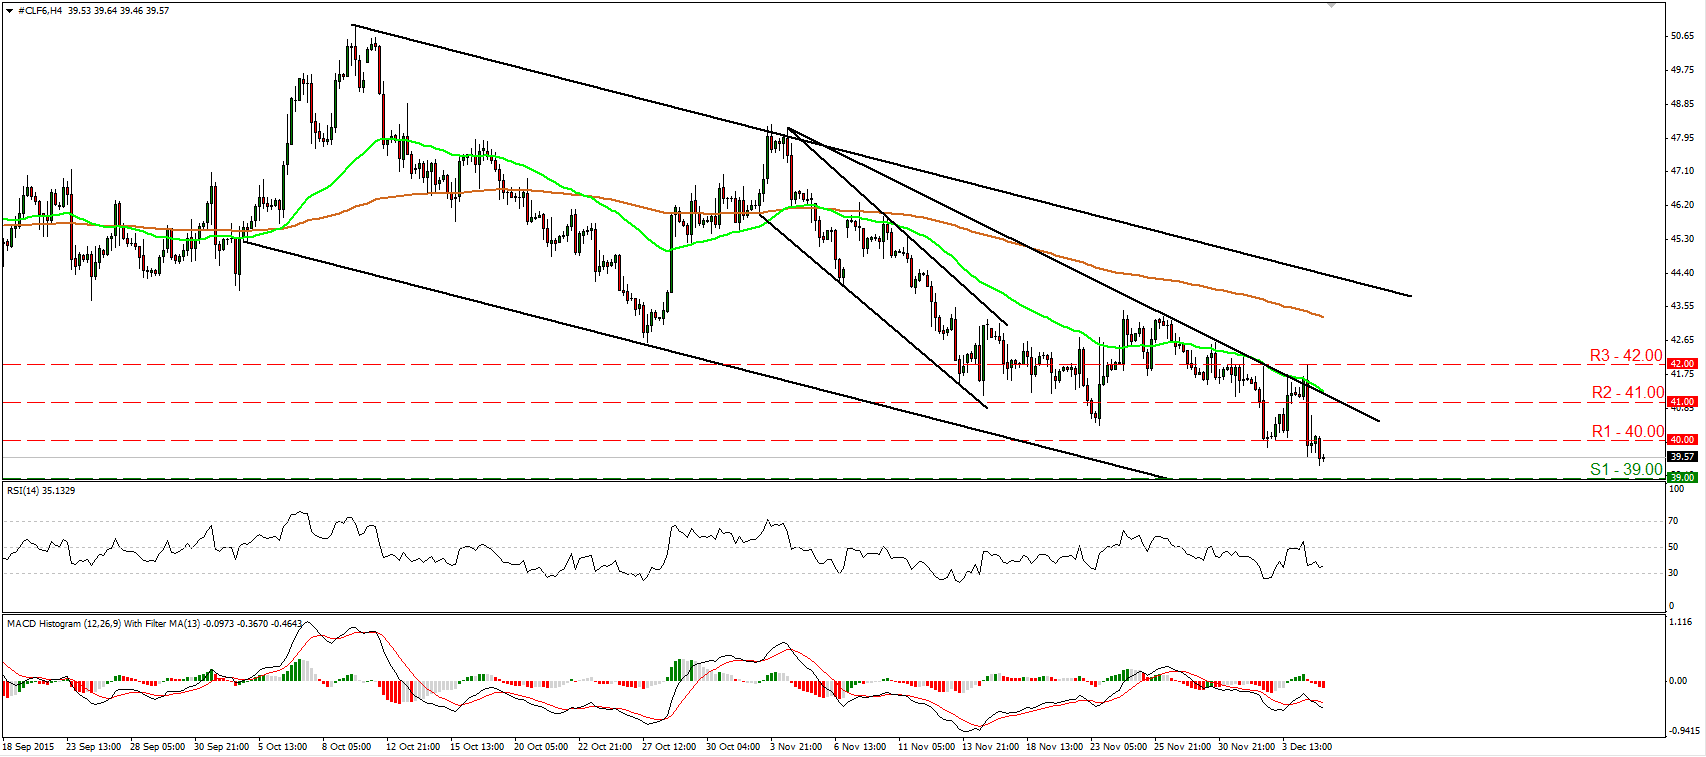
• WTI fell sharply on Friday as OPEC members were unable to agree on a strategy to curb the continuing oversupply in global energy markets. The price fell below the psychological zone of 40.00 (R1), confirming a forthcoming lower low on the 4-hour chart and reinforcing the short-term downtrend. I believe that sellers are likely to maintain their momentum and perhaps challenge the 39.00 (S1) support area soon. A break below that level is likely to aim for the 38.55 (S2) level, marked by the low of the 26th of August. Our short-term oscillators support the notion as well. The RSI moved lower after falling back below 50, while the MACD, already negative, has topped and fallen below its trigger line. On the daily chart, WTI has been printing lower peaks and lower troughs within a downside channel since the 9th of October. Therefore, I would consider the medium-term outlook to be negative as well.
• Support: 39.00 (S1), 38.55 (S2), 38.00 (S3)
• Resistance: 40.00 (R1), 41.00 (R2), 42.00 (R3)

