Are you tired of reading about Trump or some other “XX-Exit” referendum on the horizon? Never fear. The financial headlines are now abuzz about two other topics – gold and oil. It is rare that both of these commodities have commanded such attention in the press at the same time. Gold bugs are in a festive holiday mood, claiming that the stars are aligned for a “Perfect Storm” in gold bullion. Oil buffs are also beside themselves after an OPEC meeting seemingly reached consensus that a decision to cut production was actually a good thing for all participants.
After weeks of uncertainty following Trump’s ascendance, it is refreshing to see positive sentiments abound about anything. Yes, the year end is fast approaching, a time of balancing portfolios, dealing with tax issues, and preparing for the year to come, but before analysts could publish their predictions for the coming year, we have exuberance in the streets wherever gold and oil are mentioned in the same breath. Investors at present are scurrying about, in hopes of finding that magic chart that will reveal unknown insights for the foreseeable future. The favorite one that has recently emerged is the one that speaks to a correlation between prices for the two items:

Correlations do not necessarily mean that causations exist.
Analysts can often get too enamored with their favorite charts, believing that they and only they have foreseen the future for what it might be, but when their predictions fall flat, they are nowhere to be found. People have been predicting the end of the current Bull market for several years. Who has not seen the Internet ads proclaiming that stocks are set to plummet by 80%? To the credit of the chartist that assembled the “Gold-to-Oil Ratio” shown above, he at least noted his consternation over the final peak.
Correlation charts do have a purpose. They do highlight certain incongruities in market valuations that beg for an explanation. Take the chart above for example. There have been four major peaks and one recent “spike”. A particular crisis has been assigned to each of the first four items, well known events or extreme capital outflows from emerging market (EM) economies. As for the spike, we could claim that it is due to a policy crisis within the global central banking establishment. Cheap money has led to an excess of capital investment in oil production, which has resulted in the well-publicized global oil supply glut. Oil prices fell, severely reducing the denominator in the equation.
We would be well advised to exhibit caution when viewing any correlation charts that exist today. Quantitative easing and near zero or negative interest rate policies have created a multitude of anomalies across the financial landscape. As one analyst quipped, “We have seen seeming "correlations" last a few months. And, during that time, people became so certain of the correlation being the causation of the metals movements, they began to "bet" their money based upon these seeming correlations. Yet, what happens time after time is that the correlation disappears just as quickly as it appears, leaving these gamblers (because they are clearly not investors) holding a bag of losses.” As for Gold vs. Oil, the ratio has depicted market volatility to a high degree.
Regardless of what kind of signal this heralded ratio is delivering, the point is that there is definitely strain developing within our financial markets. The mere fact that the Gold-to-Oil ratio has remained well over its long-term average of “16” for nearly three years is truly cause for concern. A variety of charts that speak to inflated PE ratios are just another area where strain has increased beyond what have always been acceptable limits. Add to these leading indicators the fact that a Trump administration will most certainly toss a few stones in the global financial pond, and one has to wonder what kind of reaction will be produced when those ripples hit the shore.
Why is there a “perfect storm” developing for Gold enthusiasts?
The previous correlation chart may suggest that a crisis of some form is possibly looming on the horizon, but it does not necessarily give an investor a “Buy” signal for the yellow metal. The performance of gold as an investment for the past 16 years has been nothing short of spectacular, even if you discount its tumble from grace since 2011. It has climbed from a value of $283 per ounce in 2000, topped out at $1884 in August of 2011, and currently resides at $1170. There had been a “Brexit” peak at $1384.
If you do the math, these movements equate to a 45% retracement from its high, somewhere between the key 50% and 62.8% Fibonacci ratios. Historians will tell you that nearly all commodities on a long-term basis tend to retrace 50% at some point in time. If this adage were to hold true, then gold could eventually seek support at the $1084 level. Coincidentally, a “20” ratio and $55 price for a barrel of oil works out to be $1100 for gold. Whether there is a lower leg down is not disconcerting. The vast majority of analysts are presently very optimistic. A new bottom may be in the works, but, looking forward, they see a perfect storm propelling Gold upward and onward.
What really drives gold valuations? Unfortunately, sentiment often trumps fundamentals. As one analyst put it: “Forecasting gold has become something akin to an esoteric and arcane art, which for some amplifies its attractiveness. Gold can turn on a whim making it unpredictable and volatile with much of its value being imputed rather than based on tangible factors such as cash flows. This certainly lends support to the claims that the value of gold is solely driven by sentiment and that sentiment is incapable of being quantified.”
How does one measure “sentiment”, if it is more emotionally and culturally based? As a matter of fact, investors have been conditioned to believe that gold is a safe haven, that it is also a hedge against inflation or inflating fiat currencies, and that it moves inversely to upward movements in the USD or interest rates. On a more recent note, “The ability of sentiment to turn on a pinhead and behave unpredictably, as evidenced by how gold reacted when a Trump victory was clear, indicates just how difficult it is to prognosticate on what the future holds for the yellow metal.”
As “Trump-phoria” continues and the Fed stiffens its resolve for a rate hike, the short-term sentiment for gold is not that good. Longer term, the level of irrational exuberance over a business-favorable environment under Trump will likely give way, once reality sets the tone. Comments from various corners of the analyst community are painting a picture that will eventually benefit gold big time:
- “The markets' enthusiasm for Trump's policies is overdone;”
- “The price of gold has dropped $170/oz since election night, the most negative 3-week change in open interest on gold since 2008;”
- “There are some significant bearish momentum divergences at play in the greenback;”
- “GOLD remains extremely oversold to the downside with 1,170 likely to remain key support;”
- “Bullish sentiment on gold is at depressed levels and nearing a buy signal.”
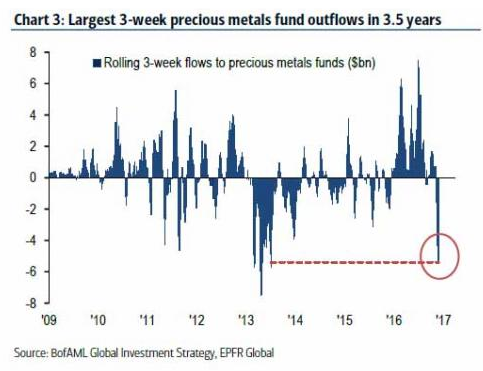
The outflow of capital from precious metal funds is also problematic:
Is it time to go long on gold? Contrarian investors are just beginning to lick their chops. Yes, there may be another lower low to contend with, but the reaction of the market has been over done, so to speak. The prices for “put” options to protect against downside risk have also escalated, a sure sign that prices are normalizing, a catchphrase for forming a new support level. The path of least resistance is down for the moment.
What is happening with oil prices?
Oil prices are also heavily dependent upon the strength of the USD, inversely as with gold. Prices, however, have been trapped between $40 to $50 barrel, due to an oil supply glut, but OPEC’s semi-annual meeting on November 30th held the promise for a production cutback. Many believed a cut was a “pipe dream”, if you will, the reason why the announcement of a “1.2 million barrel per day production cut that will take effect in January 2017” came as a surprise to most analysts. Vladimir Putin is given credit for arm-twisting in the background. Russia’s foreign exchange reserves have taken a beating due to failing oil prices.
Iran, perceived to be the fly in the ointment, agreed to remain flat, while other members planned a cutback, although OPEC members have a record of cheating on these so-called agreements. The market reaction was swift, as existing short positions were squeezed. Prices leapt over $50 in a single bound in the futures markets. Short covering may push the price up to $53, and analysts are already pointing to $60, as a near-term goal for 2017. What could slow the ascent? A stronger dollar would apply the brakes, but higher prices also mean that U.S. production will surely kick in once more.
What are the implications for major currency pairs versus the USD?
Central bank policy divergence may still rule the day in the forex world, but a convergence of indications from a variety of sources is slowly forming a consensus scenario of how 2017 may play out for King Dollar. A rise and fall are in the offing, a boom and bust cycle that is inevitable once irrational exuberance confronts harsh reality. A stronger dollar will further the plight of U.S. exporters, related job losses, and a rising deficit, all counter to what a Trump administration has promised. The current debt ceiling will have to increase, which may spark political infighting, and then inflation will appear.
Timing is always everything, but Gold, if the experts are correct about a “perfect storm” in the wings, will leave a newly formed support level to create a next major leg up. As a result, it would then drag the euro and yen to stronger places, as well. Within this same context, oil prices are also destined for higher realms. $60 will be the first stopping point, but $75 may be in the cards down the road. Commodity currencies will be the obvious beneficiaries. The Loonie, the Aussie, the Kiwi, and the Norwegian Krone come to mind. The Fed will also be doing their level best to weaken the dollar and walk a tightrope at the same time. In any event, 2017 will be a rocky road, filled with trading opportunities.
Concluding Remarks
Risk Statement: Trading Foreign Exchange on margin carries a high level of risk and may not be suitable for all investors. The possibility exists that you could lose more than your initial deposit. The high degree of leverage can work against you as well as for you.