
Today’s article will dive deep into yesterday’s market action, including the aftermarket one. After another dreadful weekly unemployment claims report coming in at well over 5 million, the S&P 500 obliged lower, yet came back after two bouts of heavy selling. But it was the not-so-surprising U.S. President Donald Trump announcement that arguably stole the spotlight. Is it a game-changer?
Let’s check the S&P 500 price action during yesterday’s regular session (charts courtesy of http://stockcharts.com ).
These were our Wednesday’s observations:
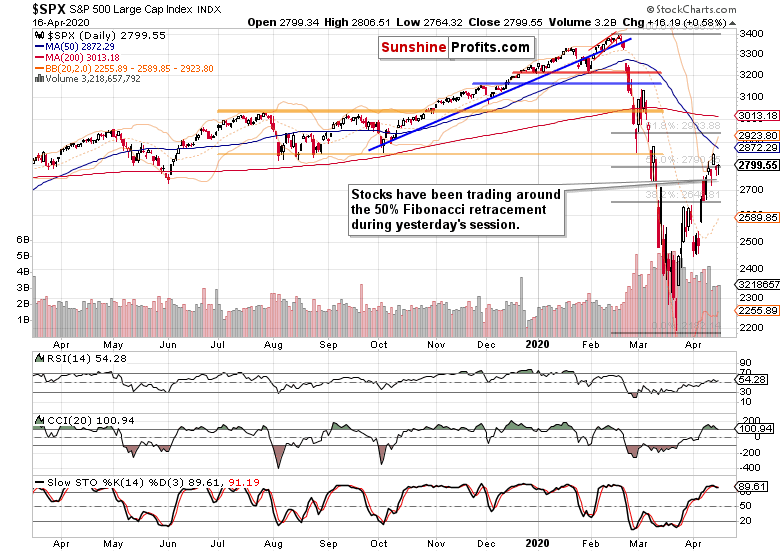
Yes, stocks broke above the 50% Fibonacci retracement and closed darn near their intraday highs. But note the low daily volume. One can be easily forgiven when looking for a much higher one on such a key resistance breakout – expecting a higher reading is justified. Moves that happen on comparatively low volume are best viewed with a healthy dose of suspicion.
Stochastics just flashed its sell signal. As it happened in its overbought territory, quite a few traders (us included) wouldn’t take it at face value, and would prefer to wait for the indicator to clear the overbought area first. CCI points to decreasing strength behind the stock upswing, and is on the verge of generating its own sell signal, while the RSI is struggling around its midline. Quite a bearish combination overall.
There hasn’t been any breaking-news technical development that would invalidate the above words. Speaking of which, we’ve commented on yesterday’s intraday comeback of the bulls this way:
As disconcerting as yet another retracement of the opening S&P 500 losses may appear, there hasn’t been any breaking-news development.
... the credit market metric of high yield corporate bonds to short-term Treasuries keeps trading down. That serves to confirm thin air as the S&P 500 challenges 2800, and actually points to a disconnect between the two markets. And it’s the bond guys who usually get it right, which is one more reason apart from the fundamental coronavirus fallout, why we expect renewed selling in stocks.
The debt markets haven’t turned around before the closing bell. Let’s check their performance in-depth.
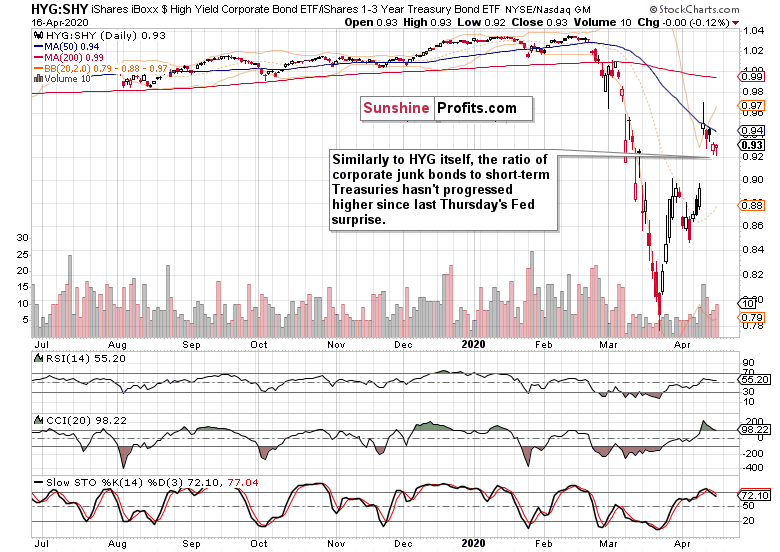
Mirroring the daily action in HYG ETF, the high yield corporate bonds to short-dated Treasuries ratio kept trading close to unchanged yesterday. While it didn’t decline profoundly, it hadn’t rallied either. And high yield corporate bonds did much better yesterday than their municipal counterparts. Munis (HYD ETF) have actually closed lower than on Wednesday. In light of such a weak performance, how did Treasuries do?
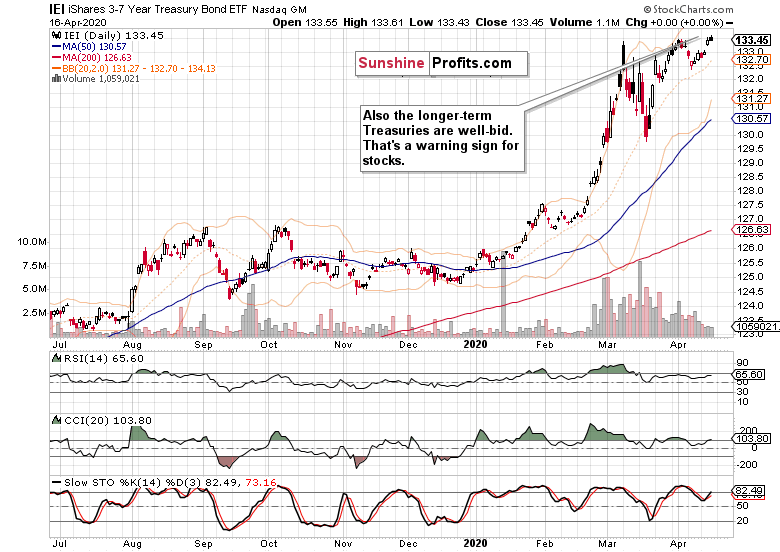
Even the longer-dated ones (IEI ETF) aren’t selling off – so, it’s not just the short-term Treasuries (SHY ETF) that are holding up more than nicely. And whenever the most secure bonds out there remain this well-supported, it sends a message of no smooth sailing ahead for stocks.
How have stocks actually fared against Treasuries recently?
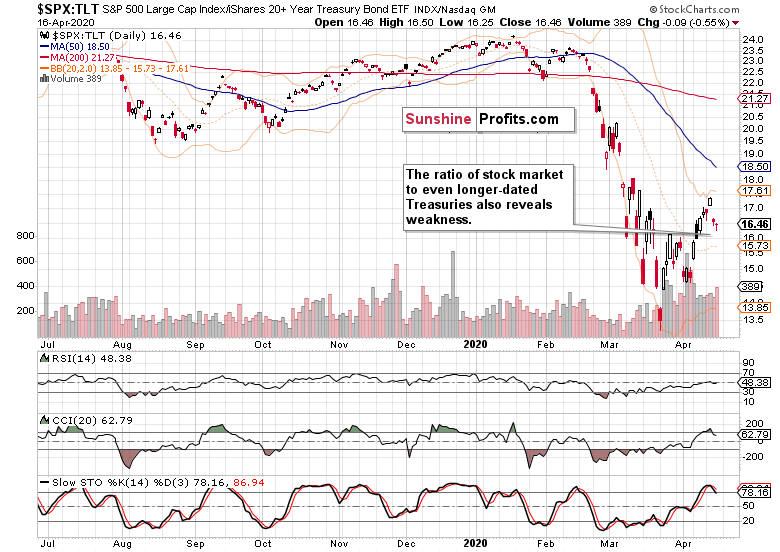
Let’s take long-dated ones – should the animal spirits be returning, that’s where the coming inflation should show up first. The fact that it doesn’t, reveals that we’re not experiencing an inflationary storm currently.
And indeed, even the long-dated Treasuries (TLT ETF) have been outperforming the general stock market in recent days.
So, how come we’ve seen such a sharp S&P 500 upswing in the light aftermarket trading yesterday? But first of all, how come stocks are showing such strength amid the divergencies and faced with grim fundamental data? Answering the second question will help us deal with the first one more efficiently. Just as we’ve seen late last week flattening of the coronavirus curve in some of the hotspots such as New York City, yesterday’s unemployment claims (as unprecedented as the figure is) have come below the 6million+ mark of two prior weeks. Is it a satisfactory flattening of the labor market curve? The bleeding is there, sizable and without an end in sight really. More layoffs are coming as the cascading through the real economy proceeds.
Even the Fed’s Beige Book dating to April 15 is saying so.
Talking flattening of the coronavirus curve, the news on the ground doesn’t fully support the optimism. Tuesday and Wednesday brought us the record number of coronavirus casualties, with 2,364 and 2,371 dead respectively. If that’s the new normal, it shows that we’ve reached no U.S.-wide plateau yet, despite the lockdown in hardest-hit New York City going into effect on March 22. That’s quite a few weeks already and that’s the case for the overwhelming majority of other states, too.
In fact, the lockdown contribution to halting the exponential spread might be exaggerated, as Mark Twain would himself say regarding reports of his death. Take a look at the comparisons to Sweden, where no lockdown has been instituted, and the country remains open for business. The country is faring reasonably well on a per capita basis.
Trump understands the need to reopen the economy, and has earlier in March called for it to happen by Easter. While that hasn’t been the case, the idea has gained traction also within Democratic strongholds on the East and West Coasts. While the governors may disagree on timing, they’re moving in the same direction.
This brings us to the catalyst of yesterday’s aftermarket upswing in the S&P 500. It has been known already on Wednesday that the president plans to unveil federal guidelines to reopen America for business. And the moment of glory came late yesterday Eastern Time.
But where is the beef, as the memorable Wendy’s ad says?
The offered guidelines are about letting some U.S. states and employers to do away with most social distancing measures within several weeks. Discussing preconditions and stages of relaxation, the document is exactly what it’s called – a guideline. In other words, it’s a federal outline.
Please remember that it’s the States’ governors who are responsible for the action on the ground. All the lockdowns have been initiated by governors, and sometimes even mayors. None originated at the federal level. While the Trump guidelines are sending an important message, its impact lies in the PR arena as it steals the spotlight while nothing groundbreaking has just yet happened statewide.
While the S&P 500 Futures like it and are clinging to most of the overnight gains (trading around 2865 currently), it’s far from a safe bet that the courage to start returning life to normal won’t backfire, and that the U.S. won’t experience another sharp increase in new infections. Look no further than to Singapore for a second wave of the outbreak. The situation in Spain is again worsening after allowing the estimated 300,000 workers to resume their roles.
Coming back to the Opening Up America Again guidelines, do they mean that the consumer is coming back in a big way?
We’re doubtful, and had this to say about the recovery prospects:
In short, the V-shaped recovery is a fantasy. We’ve discussed the disruptions in our Sunday’s special Stock Trading Alert, and encourage you to read it if you hadn’t done so already.
Take a look at China – overnight, they’ve reported the quarterly GDP figures. The drop of -6.8% is unprecedented, and their fixed asset investment and retail sales still keep falling like a hard rock on a year-on-year basis. We fully expect a similar dynamic to play out in the U.S. as well.
In the short-term though, the S&P 500 futures are about to open with a sizable bullish gap today, well over the 50% Fibonacci retracement. That’s an unconfirmed breakout and today’s session will reveal just how much momentum is really there fuelling the upswing. Stocks can certainly go higher, but can the bulls sustain the rally faced with bonds refusing to break down?
And should the buyers keep the momentum, which targets can they aim at?
The nearest resistance will be provided by the 50-day moving average, which is slightly above 2870 and reinforced by the sizable early March bearish gap. Then, it’s the 61.8% Fibonacci retracement at above 2980. The stock upswing has been having too many issues with the 50% Fibonacci retracement already to consider it a new bull market upleg, and is currently struggling at the 50-day moving average.
With the credit markets effectively nationalized, let’s take a look at the metal with PhD. in economics – does copper send a bullish message?
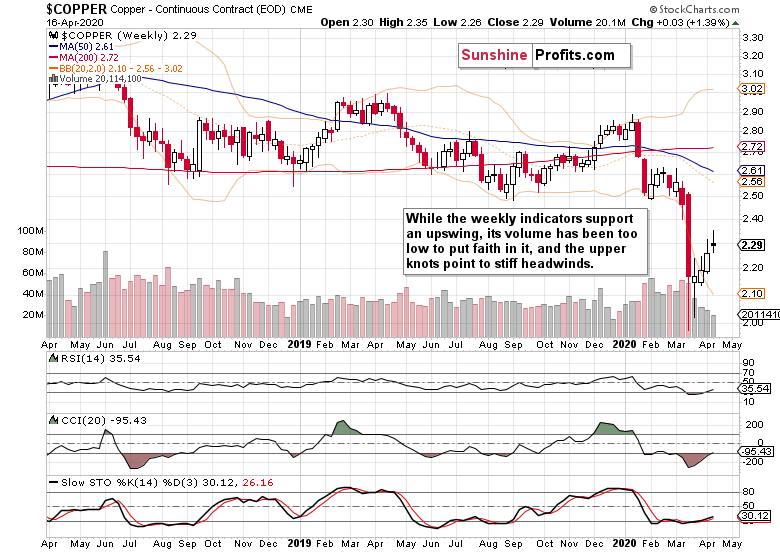
The weekly chart would technically favor the upswing but there are two signs of caution.
First, the decreasing weekly volume marking each of the preceding white candle weeks, with the currently rather sideways one bound to end up with higher volume. Should the red metal’s price have indeed stalled, that would mark a first sign of selling pressure’s return.
Second, this and previous week’s sizable upper knots point to the sellers taking advantage of the relatively weak recovery from the March lows. On balance, the message is bearish-to-neutral here, but more bearish than neutral in our
opinion.
What about the short-term copper outlook?
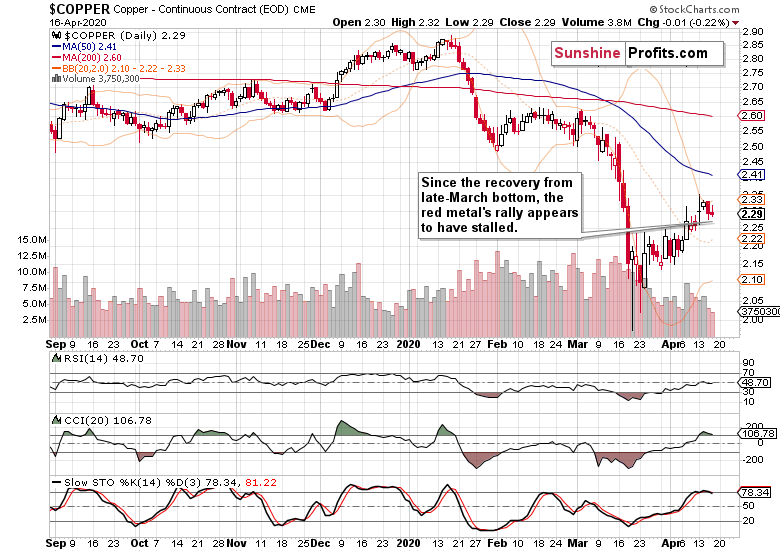
The shaky recovery is being tested as prices have pointed lower in recent days. While the daily indicators are sending a toppy message, the lower volume of recent days points to interim indecision. The risks though are clearly skewed to the downside. Just like the credit markets, copper is sending out a message of non-confirmation of the S&P 500 advance.
Summing up, while the stock bulls repelled part of yesterday’s downswing, they didn’t magically turn the outlook bullish. Tuesday’s breakout above the 50% Fibonacci retracement has been invalidated and despite today’s bullish opening gap, remains unconfirmed on a closing basis (let alone three consecutive closes). Notably, the credit markets continue to underperform the S&P 500. Copper isn’t either leading higher exactly. The risk-reward ratio simply isn’t on the bulls’ side as dreadful economic data are hitting the markets on a daily basis, and the fallout is likely to get worse before it gets better, and surprise the markets. The drive to reopen the economy may come back to bite the decision-makers as the flattened coronavirus curve still appears elusive.
Sideways trading followed by renewed selling pressure taking on the March lows, is the optimistic scenario here. The medium-term outlook for stocks remains bearish. Trading position (short-term; our opinion): short positions with stop-loss at 3050 and the initial downside target at 2200 are justified from the risk/reward perspective. It’s a big-picture trade if you will, which means that the trade parameters are relatively distant price points. Remember that you can adjust your own position sizing so that the risk per trade meets your very personal preferences. We’ll manage the open position flexibly and in line with the incoming signals supporting/refuting the projections, but the above price points are the big picture layout.