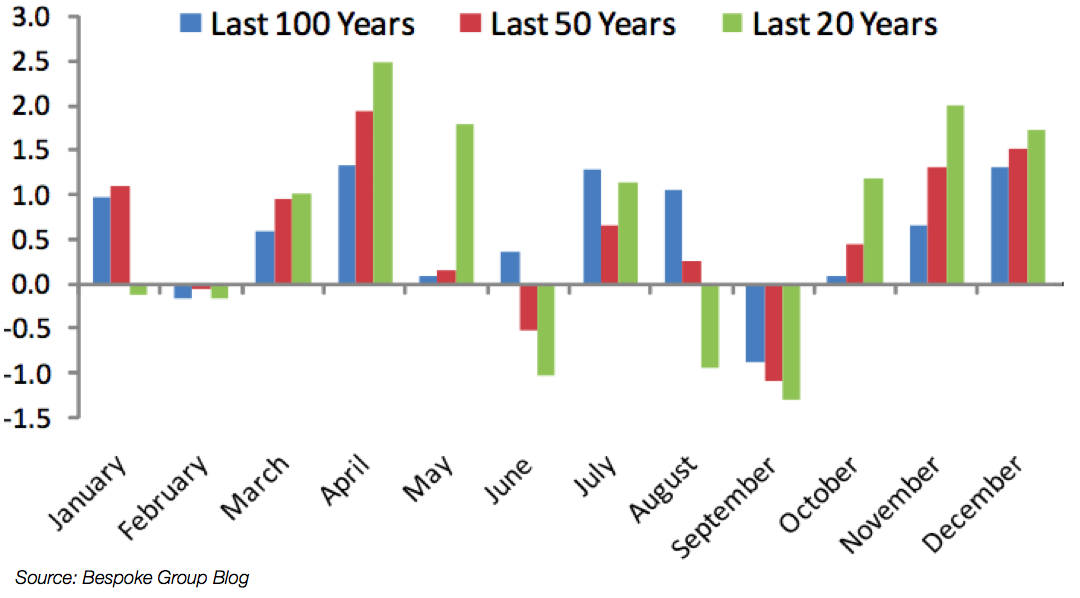
The end of the year is known for being seasonally strong. Even October, renowned as the month for exceptional drops, has recently been one of the best months of the year. Over the past 20 years, the October - December stretch has been the strongest period of the year (chart from Bespoke):
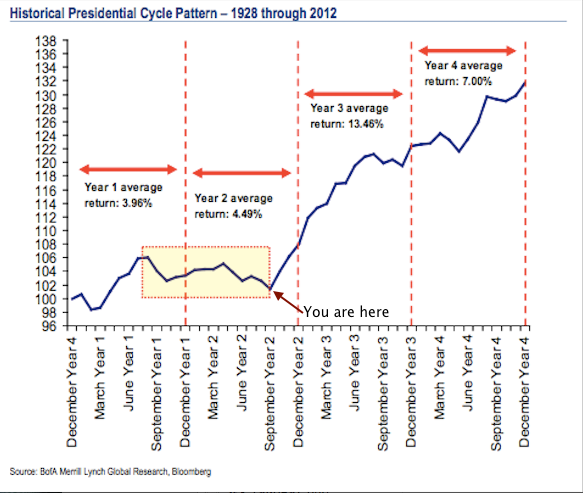
That is especially true during mid-term election years. These years usually meander until the 4th quarter, then rally. Crucially, that continues into the third presidential year when stock returns are the greatest (chart from BAML).
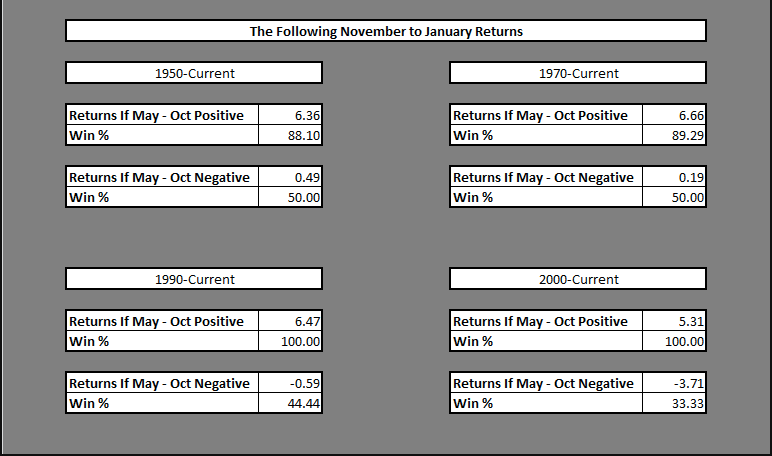
Even when the weakest 6 months of the year (May to October) are strong—like they have been this year—you should expect good stock returns into year end. In a terrific post, Chad Gassaway shows that the following three months are positive over 90% of the time (with returns over 5%) after a strong summer (read it here).
So according to the charts, you should expect great returns from stocks ahead. There's just one nagging concern.
The pattern of strength into year end has followed weakness earlier in the year. This has been the pattern in every mid-term election year since the 1970s. If markets rally in a straight line to year end, it will be the first time in at least 45 years.
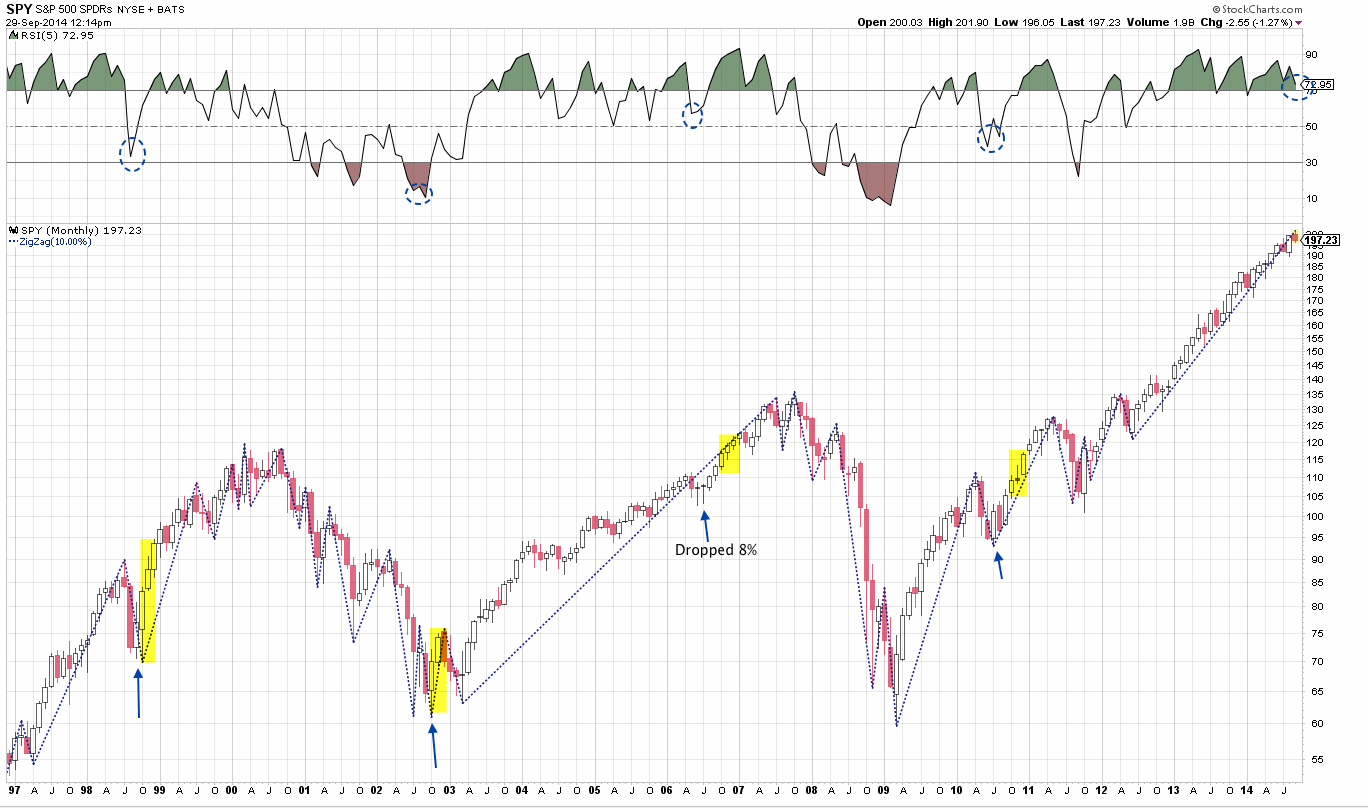
The charts below look at every mid-term election year since 1982. Highlighted in yellow is October - December. The arrow marks the low prior to the start of the 4th quarter.
1982-1994: SPX dropped at least 10% every mid-term year prior to the 4th quarter. Monthly RSI dropped below 50 (top panel). The smallest drop was in 1994; that year ended flat with November and December giving up gains made in October.
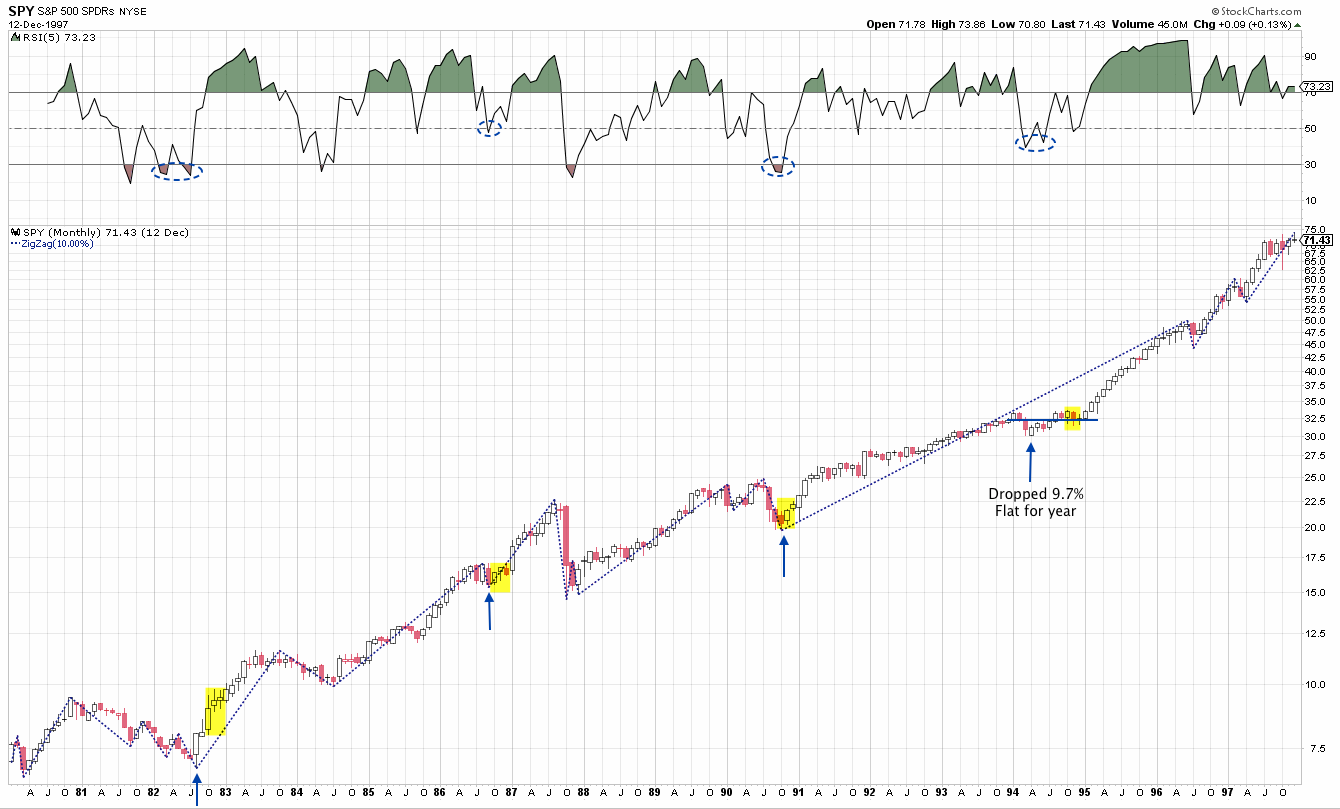
1998-2014: SPX dropped more than 10% every mid-term year except 2006, when it fell 8%. In that year, stocks were negative for the year as late as June. 2006 is also the only year since 1982 when RSI did not fall below 50 (the low was 56).
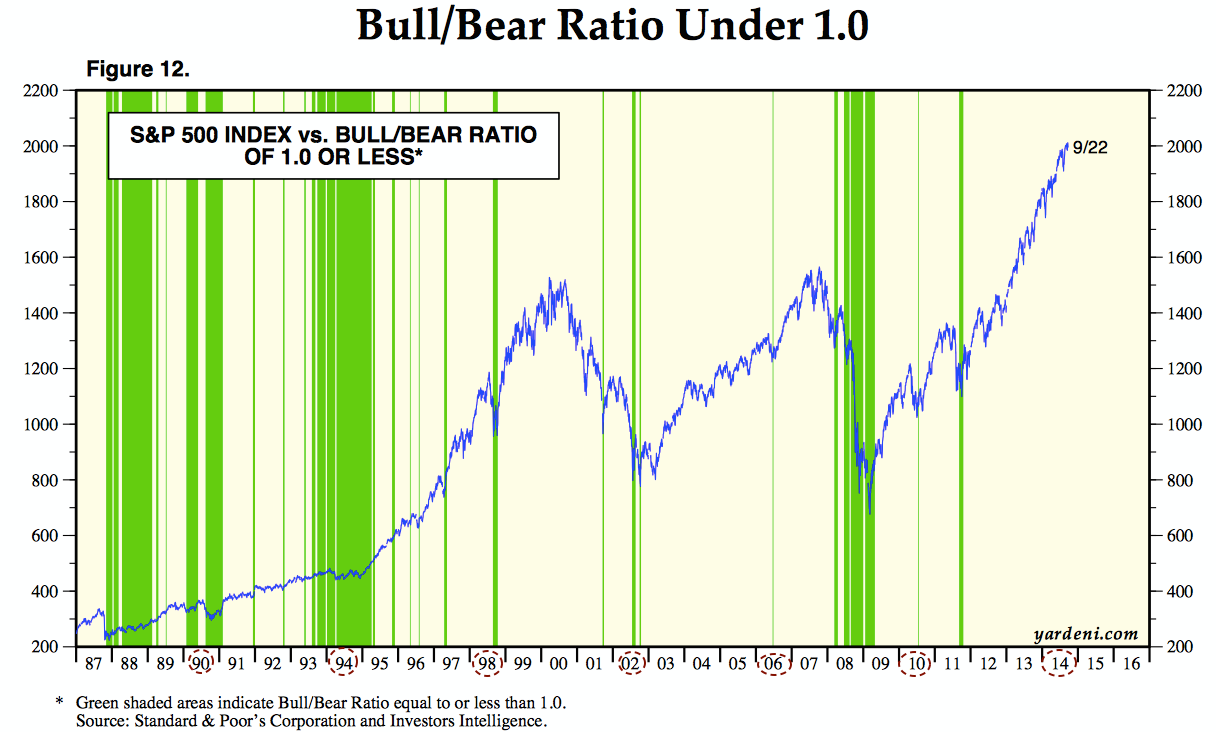
It's notable that in each of these years, investors turned strongly bearish (circles). This was true even in the best years: 2006 as well as 1994 (chart from Ed Yardeni).
Since February 2014, by comparison, the largest drop in SPX has been 4.5%. Monthly RSI has not been less that 70 (it's 73 today). And investors have not been bearish all year (or all of last year either).
The question facing investors is whether context matters for a year-end rally; in other words, has prior weakness and bearishness been a necessary set up for the year-end rally?
There's no precedent to the current market so there's no way to know for sure.
If we look at all years since 1980 (not just mid-term years), there have been just 4 where SPX rallied more than 3% from the end of September to year-end after being down less than 6% at any point during the year: 1991, which followed the negative 7% return of 1990; 1992, which was up only 4% for the entire year, all of which came in during 4Q; 1995, which followed the negative 2% return of 1994; and 2013, which benefitted from high levels of Fed and corporate liquidity.
The odds say the market will rally over the next 3 months, but that has always been under different circumstances. We would be firmly in the rally camp if interim weakness were to appear in October or November. In its absence, count us as being a bit skeptical.
