Sometimes the calendar dictates the agenda. The Labor Day weekend marks the official end of a summer that was eventful for markets. The punditry will be asking:
What is your (revised) EOY target for stocks?
Prior Theme Recap
In my last WTWA I predicted that everyone would be focused on the lessons from the prior market turmoil. That was mostly wrong, since there was too much new turmoil! As he does each week, Doug Short’s recap explains this dramatic story and his great weekly snapshot lets you see it at a glance. With the ever-increasing effects from foreign markets, you should also add Doug’s World Markets Weekend Update to your reading list.
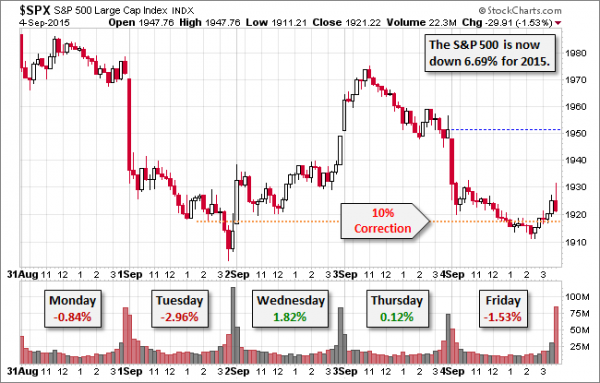
The chart shows the changing “lesson” that we might draw, starting with sharp selling on Tuesday (CNBC Markets in Turmoil back on the air), a comforting rally on Thursday morning, and the decline through the end of the week. It was an ever-changing lesson.
Doug provides several great charts, including all of the drawdowns from the most recent peak since 2009. The current weakness is the third largest.
We would all like to know the direction of the market in advance. Good luck with that! Second best is planning what to look for and how to react. That is the purpose of considering possible themes for the week ahead. You can try it at home.
Last week some advance planning was especially important. There was little time to react intelligently.
This Week’s Theme
The market correction is causing some firms to revise their year-end targets for stocks. Because the decline occurred while many were on vacation, reconsidering targets will be job one for those getting back to the office.
The question is whether the key fundamentals remain intact, or whether something has changed? Whether the bull market trends continue, or recent selling changes the trend. Simply put,
What is your year-end target for stocks?
The question encompasses an array of issues.
The Viewpoints
Last week’s presentation, which showed alternative positions as separate bullet points, seemed to confuse some readers. I was trying to illustrate opposing takes, while (as always) confining my own opinion to the conclusion. Let me try again with a different approach.
To provide a clear contrast, I am over-simplifying the bull and bear cases. Your target for the market depends heavily on the topics listed in the table below (which include some links).
| Topic | Optimist | Skeptic |
U.S. Economy | Sputtering | |
| China | Slowing gradually | Hard landing |
| Recession | Little chance in next year | Potential drag from global effects |
| Fed | Rate hike coming – gradual and irrelevant | End of Fed accommodation ends the only market support |
| Market strength | A reaction to the economy and earnings | Artificial gains supported only by Fed “pumping” |
| Valuation | Attractive considering interest rates | Dangerously high |
| Earnings | Rebound expected as energy scrolls off | More downward revisions needed |
| Inflation | Subdued, permitting continued low rates | No one believes official inflation measures |
| Target? | Fundamentals intact: 10-20% | Downside retest needed. Look out below |
While the correspondence is not perfect, the optimists include many of the chief global strategists from major firms, professional economists, and investment managers who take a value perspective. The pessimists include most of the trading community, bond managers, “independent” economic thinkers, and conspiracy buffs. If you are inclined to disagree, I invite you to make your own list and share results in the comments. You might start by reading this week’s cover story in Barron’s, U.S. Stocks Could Rally More Than 10% by Year End.
This contrasts sharply with nearly any site with a short-term, trading focus. The difference is simply a statement of fact. The question is, “Why?”
Scott Grannis suggests (including an interesting series of charts) that the only change has been in volatility.
What’s the source of the volatility? It could be the disconnect between investors’ fears of the future and the lack of evidence that the fundamentals of the U.S. economy are deteriorating. Fears can’t get traction if they don’t impact the economy in some fashion, but they can make for choppy markets.
As always, I have my own ideas in today’s conclusion. But first, let us do our regular update of the last week’s news and data. Readers, especially those new to this series, will benefit from reading the background information.
Last Week’s Data
Each week I break down events into good and bad. Often there is “ugly” and on rare occasion something really good. My working definition of “good” has two components:
- The news is market-friendly. Our personal policy preferences are not relevant for this test. And especially – no politics.
- It is better than expectations.
The Good
There was some very good economic news.
- Auto sales were strong at a seasonally adjusted annual rate of 17.7 million. This is the best level in ten years. This is an important economic indicator.
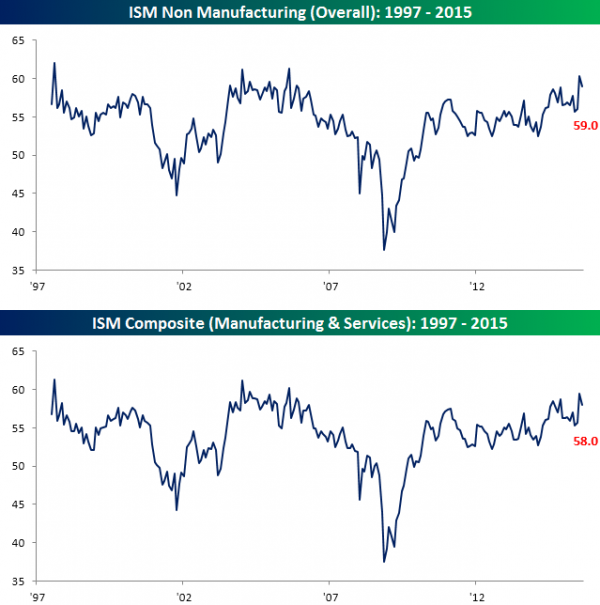
- ISM non-manufacturing registered 59, beating expectations and signaling continued solid expansion. Bespoke has the story and this chart combining both ISM reports:
- Loans for new homes are no longer so scarce. (WSJ).
- The Fed Beige Book was positive. (Calculated Risk).
- State economies look solid. The Liscio report (via Barry Ritholtz) has a comprehensive summary.
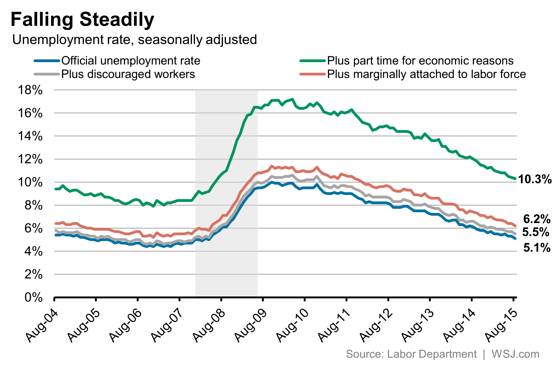
- Employment improved by most measures. The ADP private employment report showed a gain of 190K. Unemployment was lower. Wage gains were 2.2% on a year-over-year basis. See below for discussion of the miss on the headline payroll employment number. The WSJ has a nice nine-chart package with the key results, including unemployment.
The Bad
There was only a little negative data last week, despite the weak stock performance.
- Payroll employment gains were only 173K, missing consensus expectations of 200K or so. I am listing this as a negative, although the CNBC panel called the overall report “solid.” Here are some of the reasons:
- Prior month revisions added over 40K jobs.
- August is typically revised higher.
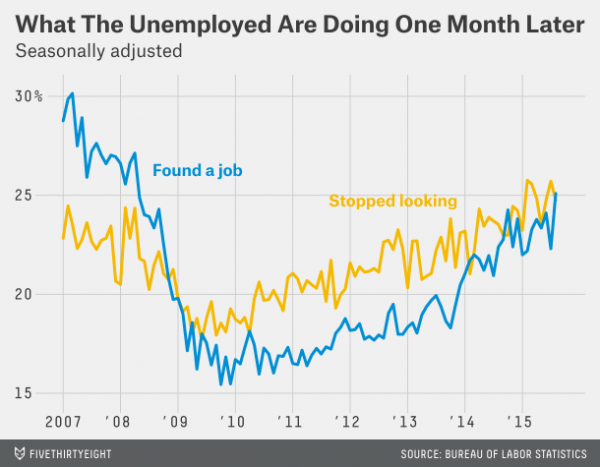
And a generally upbeat view from fivethirtyeight, including data on what the formerly unemployed are doing:
- Factory orders missed expectations with a gain of only 0.4%.
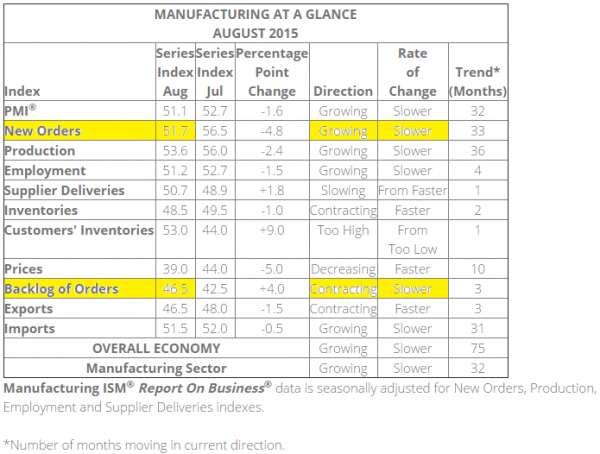
- ISM manufacturing was weak at 51.1, below expectations. It is basically consistent with modest economic growth overall. Steven Hansen notes that the businesses surveyed now constitute only about 10% of the economy. See his post for a complete analysis.
The Ugly
Illinois finances. Even lottery winners are not getting paid. The State does not seem to realize that this is not good for business!
The Silver Bullet
I occasionally give the Silver Bullet award to someone who takes up an unpopular or thankless cause, doing the real work to demonstrate the facts. Think of The Lone Ranger.
This week’s award goes to David Templeton, writing at Horan Capital Advisors. He takes on the apparently scary topic of the “death cross” finding it to be more of a buy signal. Check out his charts and analysis, leading to this conclusion:
Moving averages are lagging indicators by the nature of their construction. In other words, the patterns traced out in the moving averages follow the price of an index or stock. When the death cross is triggered then, it is likely most of the price decline in the index or stock has already occurred. Again, the exception is around recessionary economic periods and our current view at HORAN Capital Advisors is the U.S. economy continues its slow growth pace and does not tip into recession.
Noteworthy
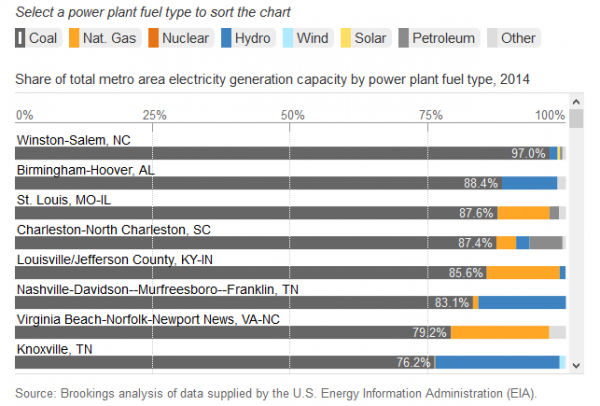
Regardless of your opinion about current clean power initiatives, it is interesting to know the sources of power for the 100 largest cities. This Brookings story, using EIA data, is informative and provides an enjoyable interactive chart. The representation below does not do it justice, so visit the site and sort on your own criteria.
Quant Corner
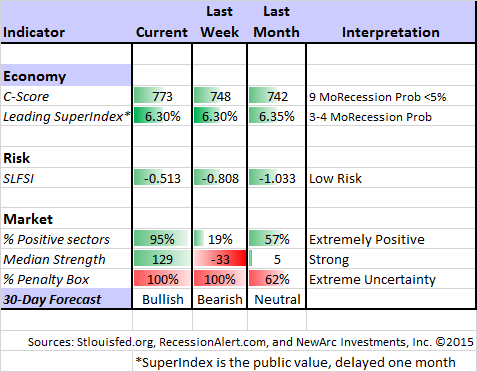
Whether a trader or an investor, you need to understand risk. I monitor many quantitative reports and highlight the best methods in this weekly update. For more information on each source, check here.
Recent Expert Commentary on Recession Odds and Market Trends
Bob Dieli does a monthly update (subscription required) after the employment report and also a monthly overview analysis. He follows many concurrent indicators to supplement our featured “C Score.”
Doug Short: Provides an array of important economic updates including the best charts around. One of these is monitoring the ECRI’s business cycle analysis. Jill Mislinski has joined Doug’s team and provides this week’s update.
RecessionAlert: A variety of strong quantitative indicators for both economic and market analysis. While we feature the recession analysis, Dwaine also has a number of interesting systems. These include approaches helpful in both economic and market timing. He has been very accurate in helping people to stay on the right side of the market.
Georg Vrba: An array of interesting systems. Check out his site for the full story. We especially like his unemployment rate recession indicator, confirming that there is no recession signal. He gets a similar result from the Business Cycle Indicator. Georg continues to develop new tools for market analysis and timing, including a new market climate indicator to reflect risk levels. The market risk is edging higher.
Scott Sumner explains the “pseudo recession” effect in foreign markets. This is a thoughtful and clever post which will help investors keep the right perspective.
The SLFSI has reacted to the market with a bounce from the extremely low levels of recent years. This change caught some recognition from Paul Vigna (WSJ). He accurately notes that it is not signaling danger. The article accurately concludes:
This means the market is still in an environment of remarkably little stress, despite the screaming headlines to the contrary. To us that means sentiment, despite some reports elsewhere, is still historically, even remarkably, sublime. The market hasn’t even begun to panic.
I have been featuring this report for years, after making it one of our summer research projects. More complete findings are available upon request, but here were two key conclusions:
- This is not a market-timing tool, but a measure of risk.
- The important risk threshold is somewhere around 1.1.
We are not even close to a high risk level.
Yet another good source – BlackRock – weighs in on the low probability of a recession, analyzing all of the negative arguments.
The Week Ahead
It is a rather light week for economic data. I highlight what I see as important. For a comprehensive listing I use Investing.com. You can filter for country, type of report, and other factors.
The “A List” includes the following:
- Michigan sentiment (F). Good read on employment and spending.
- Initial jobless claims (Th). The best concurrent news on employment trends, with emphasis on job losses.
- JOLTs report (W). Labor turnover report is still widely misunderstood. Fed uses it as an indicator of structural changes in the labor market.
The “B List” includes the following:
- PPI (F). Continues at an uninteresting level for now.
- Crude oil inventories (W). Current interest in energy keeps this on the list of items to watch.
Non-US markets trade on Monday while the US is closed. Various reports on the Chinese economy will be released before Tuesday’s opening. These have typically had a negative effect, even when meeting (modest) expectations. It is a quiet week for Fed officials with the FOMC meeting looming.
How to Use the Weekly Data Updates
In the WTWA series I try to share what I am thinking as I prepare for the coming week. I write each post as if I were speaking directly to one of my clients. Each client is different, so I have five different programs ranging from very conservative bond ladders to very aggressive trading programs. It is not a “one size fits all” approach.
To get the maximum benefit from my updates you need to have a self-assessment of your objectives. Are you most interested in preserving wealth? Or like most of us, do you still need to create wealth? How much risk is right for your temperament and circumstances?
My weekly insights often suggest a different course of action depending upon your objectives and time frames. They also accurately describe what I am doing in the programs I manage.
Insight for Traders
Felix has switched to “bullish,” one of our fastest changes in history. Felix remains only partly invested because of the extremely high level of uncertainty. Felix does not explain these changes, but I observe the sector charts. Felix likes sectors that pull back from the highs and show some evidence of basing. From that perspective we are near the bottom of a possible trading range with plenty of upside. The confidence in this three-week forecast remains extremely low with nearly all sectors in the penalty box.
Felix withdraws from the market when volatility gets very high. It is simply not a good environment for the model. Many system-oriented trading firms have temporarily suspended trading. There is nothing wrong with waiting for better conditions. For more information, I have posted a further description — Meet Felix and Oscar. You can sign up for Felix’s weekly ratings updates via email to etf at newarc dot com. Felix appears almost every day at Scutify (follow him here).
Morgan Stanley issues a “full house” buy recommendation on global stocks based upon their timing indicators. It is an interesting agreement with Felix.
I like trading analogies because they force us to drop our predispositions. Those from sports often work well, so check out this post from Tradeciety. My favorite is from baseball (because of the value of hitting singles and doubles). The chess example is not as strong. I won my University Chess Championship many years ago, and I assure you that thinking one move ahead will get you nowhereJ
Insight for Investors
I review the themes here each week and refresh when needed. For investors, as we would expect, the key ideas may stay on the list longer than the updates for traders. Major market declines occur after business cycle peaks, sparked by severely declining earnings. Our methods are focused on limiting this risk. Start with our Tips for Individual Investors and follow the links.
We also have a page summarizing many of the current investor fears. If you read something scary, this is a good place to do some fact checking.
Other Advice
Here is our collection of great investor advice for this week.
If I had to pick a single most important article, it would be this interview will Bill Nygren of Oakmark. I like to track what other value managers are thinking, so I have seen several Nygren interviews. He has not been a big recent buyer, because he had found plenty of bargains before the correction! Read the entire interview for some stock ideas. Here is the key takeaway on the market:
Some people interpret the market as fairly valued and think it must be time to sell. We would think that a fairly valued market means you should expect returns going forward that are about average. And average has been a [few percentage points] a year more than you can get in intermediate term bonds. So it’s not a super exciting number, compared to it tripling over the last six years. But I think an equity investor today who is invested for the long-term can expect a mid- to upper-single digit minimum return in the market. I think there are certain areas where investors are still skeptical because performance was so poor six years ago, like financials, where if you tilt your portfolio in that direction you’re likely to do better than the market.
Stock Ideas
Asset Managers – especially Franklin Resources. Barron’s takes up the prospects for this sector, beaten down from recent market action.
Put selling? The volatility spike has presented opportunities in blue-chip stocks. (Steven M. Sears at Barron’s) JM — Be careful about size! Only sell the number of puts corresponding to shares you would actually be willing to buy at that price.
Put buying? Beware of purchases when fear is high. Alpha Architect explains how costs soar. Check out some great charts.
Value stocks — and how to find them – from Chuck Carnevale. See both his excellent charts and the instructive analysis.
Personal Finance
Professional investors and traders have been making Abnormal Returns a daily stop for over ten years. The average investor should make time (even if not able to read every day as I do) for a weekly trip on Wednesday. Tadas always has first-rate links for investors in this special edition. As always, there are several great links, but I especially liked this post from Bankers anonymous on the importance of getting started with your investments and a plan.
My question back to my reader: How do we get people to start at the very beginning, that very good place to start?
I really don’t know how to fulfill my reader’s wish of inducing people to call up a brokerage firm, open up an account, and buy their first stock or mutual fund. I wish I had the words to express the importance of beginning, like, right now.
Market Outlook
BlackRock’s Russ Koesterich explains why the current economic and market climate is “not like 2008.”
Sean Broderick at the Oxford Club sees three reasons to buy stocks aggressively. Hint: He sees an end to several recent headwinds.
China Outlook
I have given this a lot of emphasis in recent weeks, and it is all still quite relevant. Here is a good WSJ summary illustrating that the Chinese effect cannot account for a 10% change in the value of US stocks. Of course, many believe that it was a market looking for a reason to decline. Perhaps so, but it does not hurt to keep fundamentals in mind.
Final Thought
My response to the questions of the week – once again – depends upon your time frame and objectives.
Most importantly, I do not like the concept of the year-end market target. For our individual stock positions we regularly update targets based upon the economy, earnings, and risks. You should do the same. Why is a target time frame good when it is looking a year ahead, and now only for four months? It is a silly media exercise.
The only benefit is that it stimulates a general market assessment as people return from summer vacation. More specifically, here are some thoughts for traders and investors:
- When breaking news has anything to do with the Fed, the market trades down on a hint of a rate increase. Whether or not that makes sense to you, it is a fact.
- When key technical levels are broken, the market trades lower.
- When a meme like “support may be tested” appears, it will happen. Even fundamental traders wait for the expected entry point.
The principal short-term trading ideas have played out during the summer. Algorithmic traders note these trends and swiftly adjust. Those with a longer-term perspective are aware, so they also respect the trading targets.
For those with a long-term time horizon the story is different. It has been a summer of frustration if you focus too much on monthly returns. If you understand the norms of market fluctuation it should be business as usual – taking what Mr. Market is giving you.

