Did last week signal the end of the long-awaited market correction? Less than 10%? What was behind the reversal in stock prices?
The most definitive piece of good news was the end of the debt ceiling debate, although that should not have been a surprise. The Yellen testimony set a record for length, but also lacked surprise.
It was a good week for stocks, but one that left pundits scratching their heads. Is the correction over?
Last Week's Theme Recap
I expected most of last week's attention to be on testimony from new Fed Chair Janet Yellen, starting Tuesday and culminating in front of the Senate Banking Committee on Thursday. On Tuesday this looked like a good call, but the weather intervened. Yellen's testimony was postponed as Congress left early for the February recess, which ends on the 24th. Yellen will repeat her statement, but the Senate questioning could be quite different.
While I have frequently discussed weather effects, even giving my "ugly" award to the polar vortex in a recent post, it played a larger role than I expected last week.
Readers are invited to play along with the "theme forecast." I spend a lot of time on it each week. It helps to prepare your game plan for the week ahead, and it is not as easy as you might think.
This Week's Theme
The market rebound in the face of weak economic data challenges pundits of all stripes. The improvement in earnings now seems like history, with renewed focus on yet another "soft patch" in economic data. Some will attribute this to the weather, but that explanation (excuse?) can only persist for another month.
Is the correction over? Here are five basic positions:
- Seasonality. Cash inflows favor stocks early in the year. Even the "sell in May" (or March or April) gang is throwing in the towel on timing.
- Technical analysis. Charles Kirk's excellent weekly chart show demonstrates the dramatic shift from bearish to bullish setups for traders. This site requires a modest annual fee which anyone would quickly recover from better trading and investing. Charles adjusts with the data. (Our Felix model frequently agrees with Charles. Good for Felix!)
- Short covering. Too much of the hot money continues to play for a correction. They were caught off base last week.
- The Fed. Back to the favorite explanation. Something from Yellen shows fresh support for stocks.
- Housing. Some see a real turnaround. Joining Calculated Risk (see here) in the bullish camp is Applied Global Macro Research, with an out-of-consensus forecast of 4% GDP growth. They see pent-up demand in housing. Like Calculated Risk, they were also accurate on the downside. (See the Barron's cover story).
As always, I have some thoughts that I will share in the conclusion. First, let us do our regular update of the last week's news and data. Readers, especially those new to this series, will benefit from reading the background information.
Last Week's Data
Each week I break down events into good and bad. Often there is "ugly" and on rare occasion something really good. My working definition of "good" has two components:
- The news is market-friendly. Our personal policy preferences are not relevant for this test. And especially -- no politics.
- It is better than expectations.
The Good
Much of the recent news was pretty good.
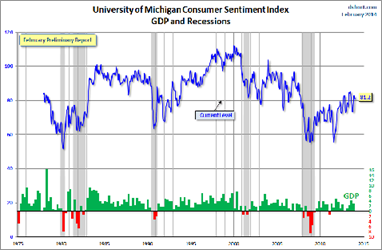
- Michigan sentiment was solid. While not a big move, it contrasts with plenty of negative economic data. Doug Short's combination of the history of the series with economic growth and recessions is my favorite sentiment chart:
- Earnings have beaten expectations. FactSet summarizes as follows:
Earnings Scorecard: Of the 399 companies that have reported earnings to date for Q4 2013, 71% have reported earnings above the mean estimate and 66% have reported sales above the mean estimate.
Earnings guru Brian Gilmartin analyzes the forward earnings implications for 2014. Is a 20% gain possible?
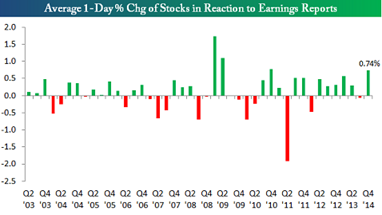
The market reaction has often been critical, seeking out any flaw in forward guidance, underlying metrics, or the elusive "earnings quality." Despite this skepticism, stocks have rallied on earnings days, as shown in this great chart from Bespoke:
- No imminent debt ceiling or budget issue. This development seemed to take the market by surprise on Tuesday. I trust that regular readers fully expected the outcome at some point. As I have often noted, the GOP has decided that the debt limit/government shutdown is not a winning political strategy. It is better to focus on ObamaCare, at least going into the mid-term elections. Regardless of what you think about the policies involved, this is a market-friendly move. We will not face a debt ceiling or budget crisis for the next year. This might have been the most important news of the week. Only last week I was bemoaning the lack of progress!
- Eurozone GDP increased more than expected – 0.3%. This is reflected in economic news and interest rates from various specific countries – a pattern of improvement.
- Yellen reassured. Tim Duy has an excellent account, covering all of the bases. His charts and analysis show the specific factors involved in future decisions, but also the flexible nature of the interpretation. Helpful charts as well.
- The market did not crash 40%, as predicted by a prominent market-timer. I noted last week that many individual investors may have been scared out of the market by the attendant publicity. To my surprise, an experienced trader opined that many hedgies were caught leaning the wrong way because of this. That might explain the apparent short-covering, but not why anyone would pay 2 and 20 to people who would fall for silly chart manipulation.
The Bad
There was plenty of bad news.
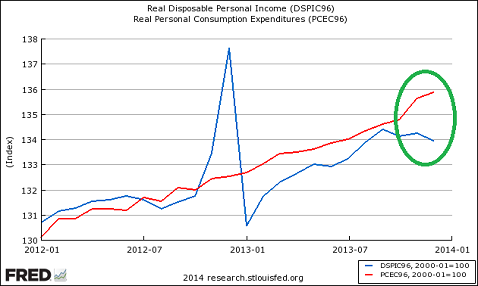
- Consumers are spending beyond their means. Can this continue? Steven Hansen raises the concern that this cannot continue. (Scott Grannis thinks that it just shows confidence in the economy and improved balance sheets).
- Industrial production declined 0.3%. This was a big surprise versus expectations of a 0.3% gain. Steven Hansen analyzes the unadjusted data and suggests that the results are even worse. The Capital Spectator muses about weather.
- Weather costs may have been as much as $50 B and 76,000 jobs. (CNBC).
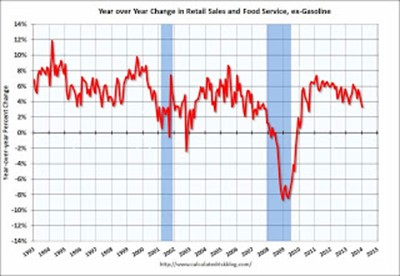
- Retail sales fell 0.4% confirming reports from some specific stores. Calculated Risk has analysis and charts, including this one:
The Ugly
Facebook fraud. I guess you can no longer buy "likes" from a click farm, but you can do the same thing officially through Facebook. Thanks to Barry Ritholtz for highlighting the issue with a fascinating video. With the growing importance of social media, we need to beware of false metrics. I check in on Facebook (FB) a couple of times a week to keep up with friends. For me it is personal, not business. I also ruthlessly defriend or ignore anyone who uses this as a political platform. (My little sister has returned from exile). I want to have fun. I also have no position in the stock.
The Silver Bullet
I occasionally give the Silver Bullet award to someone who takes up an unpopular or thankless cause, doing the real work to demonstrate the facts. Think of The Lone Ranger. Reader nominations are always appreciated!
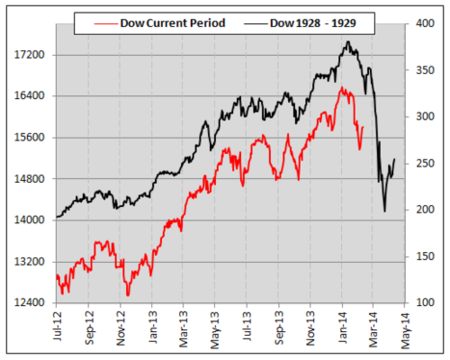
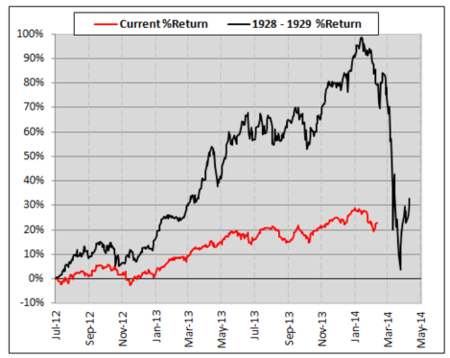
This week's award goes to those who stepped up with a timely debunking of the infamous 1929 chart – Ryan Detrick of Schaeffer's and Bespoke Investment Group.
First – a little background.
Despite our warning last week, this fear was getting mainstream traction. Mark Hulbert (when was his last bullish column?) wrote:
"The picture isn't pretty. And it's not as easy as you might think to wriggle out from underneath the bearish significance of this chart." This week Barron's quotes Raymond James' Jeffrey Saut. "I have been in this business for over 43 years, yet I do not ever recall getting as slammed with the same e-mail as many times as I have about the attendant 1929 comparison chart."
In the unlikely event that you have not seen it, here it is:
Ryan Detrick did not have any trouble with Hulbert's wriggling. He simply noted the difference in the scales, adjusting for an apples-to-apples comparison:
See the full article for a comparison of the current market streak with those of the past.
The Bespoke team did a similar analysis for subscribers – the same day as the Hulbert column. They have shared the link to their great charts.
Quant Corner
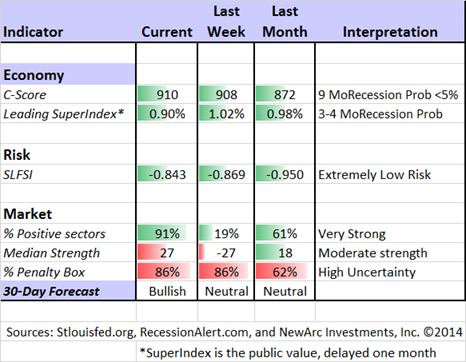
Whether a trader or an investor, you need to understand risk. I monitor many quantitative reports and highlight the best methods in this weekly update. For more information on each source, check here.
Recent Expert Commentary on Recession Odds and Market Trends
Georg Vrba: Updates his newest indicator, showing an increase in the "weeks to recession" from 26 to 27. This does not mean that there will be a recession in 27 weeks. Instead, it shows that the chance is "statistically remote" that a recession would start during that time.
RecessionAlert: Sees improvement in leading indicators for US growth, while highlighting danger areas worth monitoring. See the article for detailed charts on each indicator.
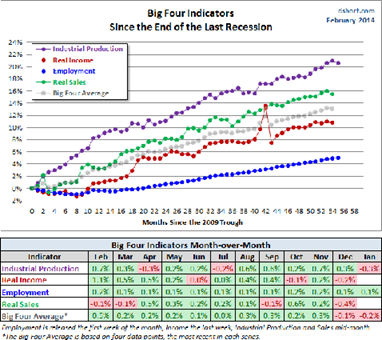
Doug Short: An update of the regular ECRI analysis with a good history, commentary, detailed analysis and charts. If you are still listening to the ECRI, you should be reading this update. Doug also has updated the big four indicators important to the NBER in recession dating. Everything except employment is showing a decline – small so far.
The Week Ahead
This is some important data in a shortened week.
The "A List" includes the following:
- Housing starts and building permits (T). Important for continued economic recovery. What about weather effects?
- Initial jobless claims (Th). This report covers the same week as the monthly payroll report for February.
- FOMC minutes (W). You might think we know all about Bernanke's last meeting as chair, but Fed watchers will be parsing the minutes for any hint of new information.
- Existing home sales (F). While less directly related to economic expansion, some see this as a better housing indicator.
The "B List" includes:
- Leading indicators (Th). Remains a popular indicator for many.
- PPI (W). Of secondary interest as long as increases are tame.
- CPI (Th). See PPI.
I am not very interested in the regional Fed reports. We'll get a normal ration of FedSpeak, and the last of the major earnings reports.
How to Use the Weekly Data Updates
In the WTWA series I try to share what I am thinking as I prepare for the coming week. I write each post as if I were speaking directly to one of my clients. Each client is different, so I have five different programs ranging from very conservative bond ladders to very aggressive trading programs. It is not a "one size fits all" approach.
To get the maximum benefit from my updates you need to have a self-assessment of your objectives. Are you most interested in preserving wealth? Or like most of us, do you still need to create wealth? How much risk is right for your temperament and circumstances?
My weekly insights often suggest a different course of action depending upon your objectives and time frames. They also accurately describe what I am doing in the programs I manage.
Insight for Traders
Felix made a dramatic switch from neutral to bullish. We added trading positions throughout the week, beginning on Monday and Tuesday. We were fully invested on Thursday. I had expected one of the inverse ETFs to exit the penalty box, leading to a short position, but it did not happen. As long as there are at least three attractive sectors, Felix will look for the "bull market somewhere." It now appears that even stronger candidates that might emerge from the penalty box.
Insight for Investors
I review the themes here each week and refresh when needed. For investors, as we would expect, the key ideas may stay on the list longer than the updates for traders. The current "actionable investment advice" is summarized here.
This is still an important time for long-term investors. We all know that market corrections of 15% or so occur regularly without any special provocation. Recent years have been the exception. Over the last several weeks I have emphasized the need to maintain perspective, using market declines to add to positions. (It helps if you have been actively rebalancing your portfolio and trimming winners. Then you have some cash). I have also highlighted some of the best advice. Here are highlights from this week:
Don't get emotional. Josh Brown has his own valuable take on The Chart that Wouldn't Die. He explains that it does not matter how much the chart is debunked. The sellers of fear are playing upon your emotions about risk and reward. Josh writes as follows:
The reason why this bothers me is twofold – first, it frightens investors into making poor decisions – big decisions that will have a major impact on their mental health and financial condition well into the future. Second, the more we see this kind of pornography, the more likely it is to have an impact on crowd psychology and become a self-fulfilling prophecy. It's like putting a disturbed, isolated teenager in front of violent first-person shooter video games all day. If we know that most Americans are scared to invest in their own future, what's the reason to fuel that fear even further? Sadism? Or just plain exploitative greed?
Don't get carried away by politics. Ideology is Killing Your Investment Returns, says Barry Ritholtz. He provides compelling examples covering a range of issues, ideologies, and political parties. There is a specific list of traps and this conclusion:
Once you become aware of how your biases affect your portfolios, you have a choice: You can recognize the impact it has on your thought process and make adjustments, or you can ignore it, and suffer the consequences.
Ideology remains an awfully expensive indulgence. If you feel compelled to waste vast amounts of money, consider instead collectible cars, vintage watches and vacation properties. Your heirs will thank you.
Don't think you can time the market. Cullen Roche analyzes the idea that you can wait for the big correction. He has many great points, but here is a key quote:
The "fat pitch" myth misses the way most of us get rich in markets. Most people who make sizeable gains in the markets do not swing for the fences or try to hit home runs. Sure, the home run hitters are always the people who garner the most attention. But they're also a fairly rare occurrence and the fact that someone hit a 800 foot home run in 2008 doesn't mean that person was necessarily talented or doing something that can be replicated. The thing is, most of us get wealthy in the markets by hitting lots of singles, doubles and just getting on base a lot. The best part about the market is that you don't have to swing a lot. But that doesn't mean you have to wait for fat pitches to try to hit out of the park.
And finally, we have collected some of our recent recommendations in a new investor resource page -- a starting point for the long-term investor. (Comments and suggestions welcome. I am trying to be helpful and I love feedback).
Final Thought
The market has now demonstrated renewed resilience, but no one knows for sure about corrections. For the average investor this is not the right question. It is more important to focus on fundamentals – the economy, earnings, and the risk of recession. These factors are all encouraging.
Those who have avoided the traps and misleading information have done well. Just take what the market is giving. Genius is not required! Even conservative investors should be able to beat inflation and grow their portfolios.
Fund flow data show that those who were waiting for a correction did not, on balance, do any buying. It is really tough for most to swing at the right times. The fat pitches look like knuckleballs!

