US Dollar Fundamental Outlook – FOMC meeting in focus:
The US currency had a muted last week as the focus was mainly fixated on Europe and the UK. This week, however, the attention will return to the US, predominantly on the FOMC meeting on Wednesday and inflation data on Tuesday.
The Fed will almost certainly raise rates on Wednesday so that decision alone is unlikely to affect the US dollar much.
Instead, the USD will be mainly driven by the language in the rate statement, the staff economic projections, and the language during the presser from Chairwoman Yellen.
The market has now almost completely priced out a third rate hike for this year and that leaves upside room for the US dollar. Any hint from the Fed that a third rate hike is still on the table will likely be interpreted as hawkish and consequently lift the US dollar.
EUR/USD Fundamental Outlook – Dovish Draghi hurt the euro
The dovish message from the ECB and President Draghi only marginally hurt the euro last week as investors still expect the ECB to turn hawkish sooner or later. Although the euro may continue the decline this week, selling the euro is still not recommended as most traders and investors will likely use any dips in the currency to buy it back again at lower levels.
The German ZEW sentiment index on Tuesday and the final CPI numbers on Friday will be released this week. The Final CPI releases rarely miss forecasts, but traders should still keep an eye on these because if a surprise does happen the re-pricing in the euro currency can be sharp.
EUR/USD Technical Outlook
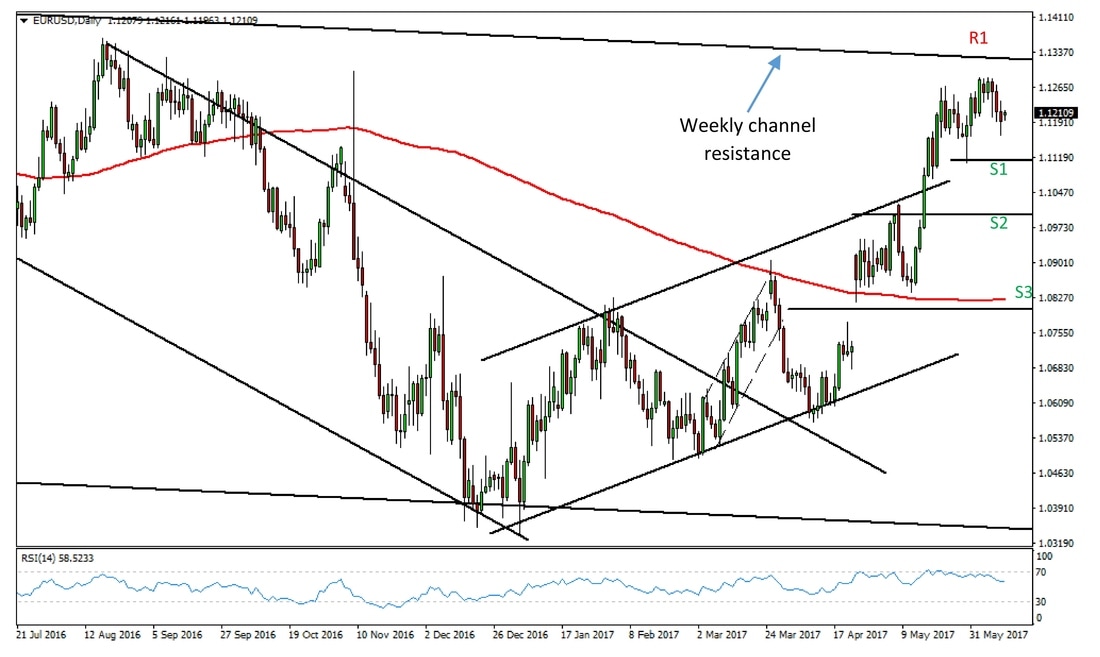
As we suggested last week, EUR/USD did move lower after almost hitting the strong resistance area at 1.13 (R1).
Still, it seems too early to call this a bearish reversal and technically, judging by the strength of the recent uptrend another push higher can not be excluded. The case for this scenario is especially strengthened since the whole 1.1300-1.1350 resistance area has not been thoroughly tested yet.
A close below the 1.11 support (S1) will help us to be more confident that this peak is going to live longer.
1.1000 (S2) is the ultimate support on this chart and a close below it will significantly increase the chances that EUR/USD will hit the 1.08 important technical area near the 200-day moving average (S3).
EUR/USD Daily chart – Too early to call a top!
GBP/USD Fundamental Outlook – A hung parliament and lot of uncertainty ahead
A hung parliament was the worst possible election outcome for Sterling and that’s exactly what we got Thursday. The British currency fell sharply as a result, to lows last seen on April 18, the day Theresa May called the snap election.
This development just adds to the already high political uncertainty in the country and with that further losses for the pound seem like the most logical scenario in the near future.
The already ambiguous position on Brexit negotiations is now set to complicate further with a coalition government in which the Conservatives will have to agree on a new Brexit position stance with some of the smaller parties.
Traders will now carefully watch for any news on Brexit negotiations and the pound will trade based on any such related headlines. That certainly sets up the pound for a lot of unpredictable and volatile price action.
Although the Bank of England meeting will take the center attention this week, the event is unlikely to cause big swings in the currency as no changes are expected in the central bank’s monetary policy stance.
GBP/USD Technical Outlook
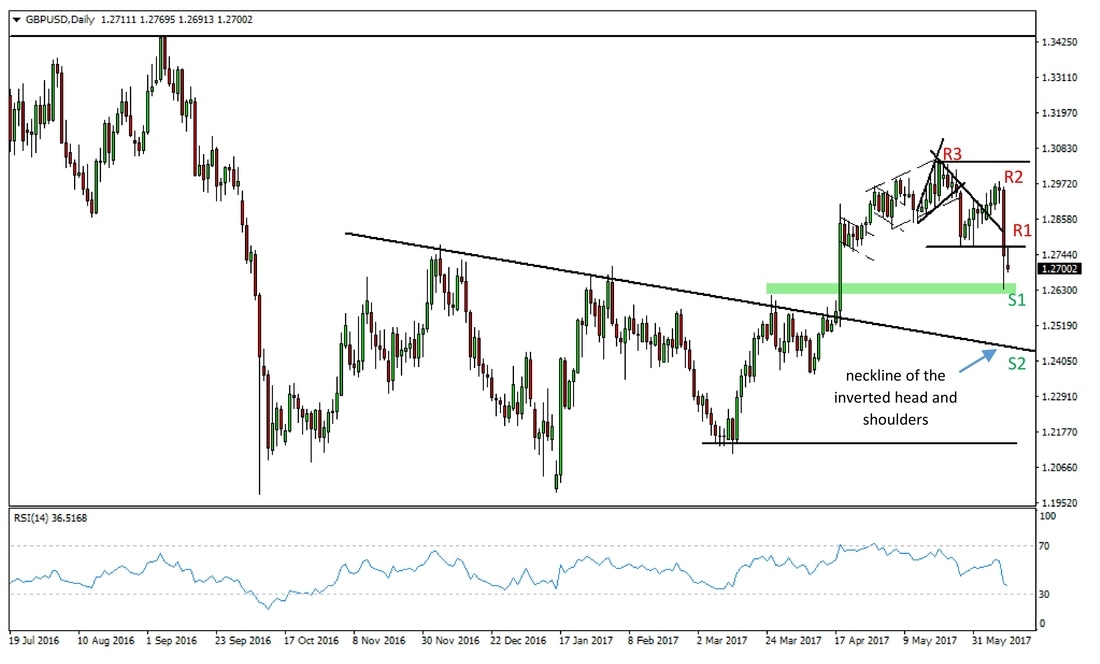
After breaking below the 1.2770 support on last week’s UK elections, the pound hit the Fibonacci confluence support area at 1.2630-1.2650 (S1). Although, there’s been some bounce from this support a bottom is still far from formed and more downside price action looks likely.
With that in mind, the 1.2400-1.2500 area (S2) is the next important support area lower that GBP/USD is likely to reach if this downtrend extends.
The 1.2770 previous support is now the first resistance to the upside (R1), ahead of the resistance highs at 1.3000 (R2) and 1.3050 (R3).
GBP/USD Daily Chart - Moving toward the neckline of the Head & Shoulders
USD/JPY Fundamental Outlook – Watching the BOJ and US Yields
The Bank of Japan meeting this week is likely to be a non-event as well as no major changes are expected from the Japanese central bank. The BOJ is likely to repeat its dovish stance and restate its commitment to bring back inflation to their target by continuing the quantitative easing program.
The high correlation between US Yields and USD/JPY will continue to drive the currency pair.
Although the 10-Year and 30-Year US Treasury yields broke below technical support there were signs of a bottom last week and if we see a bullish turnaround here then USD/JPY is likely to follow and move higher as well.
USD/JPY Technical Outlook
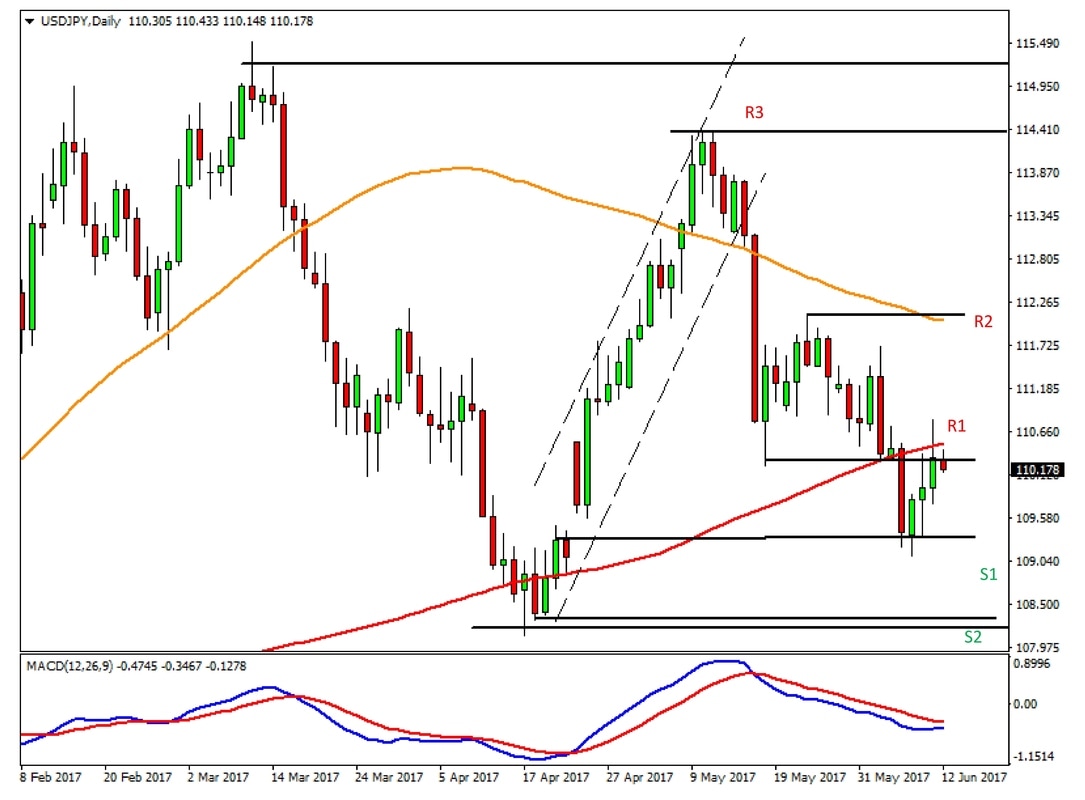
The same chart from last week is still relevant here as the USD/JPY pair has been bouncing between the support and resistance levels we specified.
Although USD/JPY almost fell to 109.00, it closed last Tuesday only at 109.40, right at the support (S1) and then moved higher from there.
Now the pair stands at the former support of 110.50-110.20 which is now resistance (R1). A close above this zone will at the minimum confirm a near-term bottom in USD/JPY.
The 112.00 area near the 100-day moving average remains the next resistance higher (R2).
The lows at 108.00 are major monthly resistance (S2).
USD/JPY Daily Chart - Will the bottom be confirmed this week?
