Get 40% Off
👀 👁 🧿 All eyes on Biogen, up +4,56% after posting earnings. Our AI picked it in March 2024.
Which stocks will surge next?
Unlock AI-picked Stocks

Weekly Charts Survey: Yield To Yields

Published 04/13/2014, 12:30 AM
Updated 07/09/2023, 06:31 AM

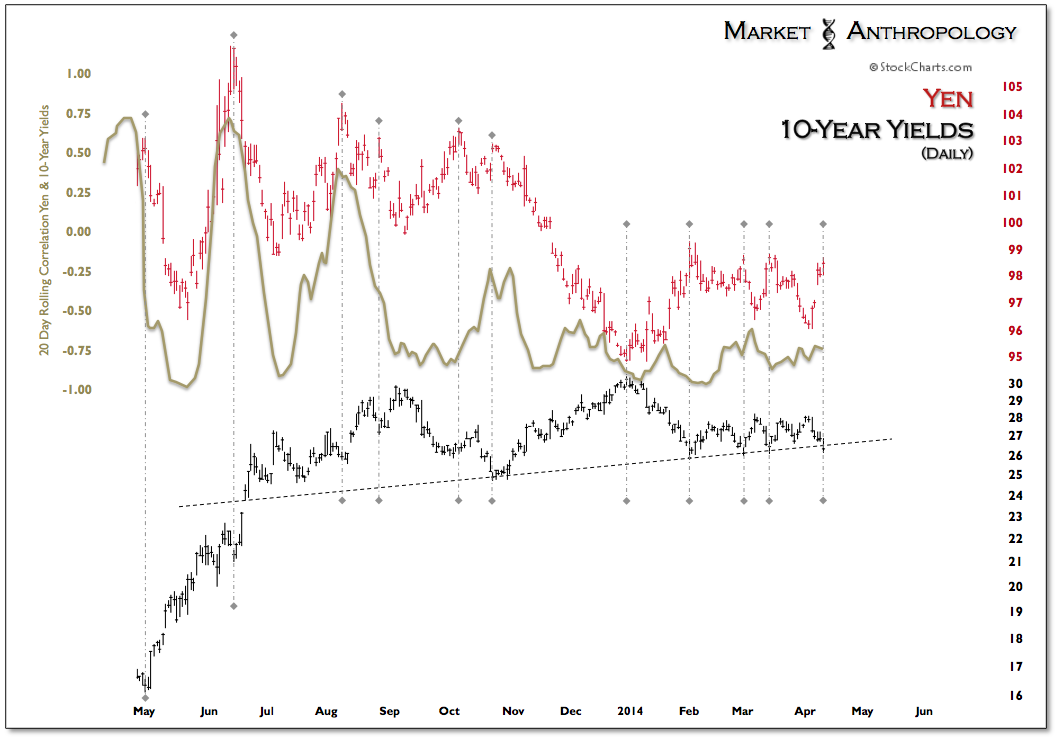
On Friday, 10-Year yields slid into their skipped-stone support from the breakout range they have meandered in since last summer. They then broke through mid-morning, accelerating the downside reversal in the equity markets and a strengthening bid beneath the yen

Clearly depicted in the chart below, the strong inverse relationship between these two risk proxies has tightened considerably as our own domestic equity fronts have collided with several different pressure systems. Namely, the trap door we have expected would open in Japan - and participants beginning to come to terms with the end of QE. As the markets flounder further and volatility creeps higher, we suspect that the discussion surrounding QE and its impact to the market will only grow louder and more confusing.  

Yen vs. 10-Year Yields Daily
What we do know is that while correlations may be strengthening in some corners of the market, the indiscriminate tightness we witnessed across assets in 2011 as the Fed last attempted to step away, or 2008 as the Fed rushed to the accident scene - are not present. It really has become a market-picker's market in 2014. 

A snapshot of this weeks performance through Thursday's close tells the story. 

                 SPX  -1.75%                                    US Dollar Index -1.35%
                 IBEX -3.19%                                    Euro +1.33%
                 Japan   -4.49%                                Yen +1.72%
                 EEM +1.28%                                    Australian Dollar +1.34   

3rd party Ad. Not an offer or recommendation by Investing.com. See disclosure here or remove ads .
                 CRB +1.78%                                    Gold +1.21%
                 FXI +2.98% (SSEC + 4.43%) 

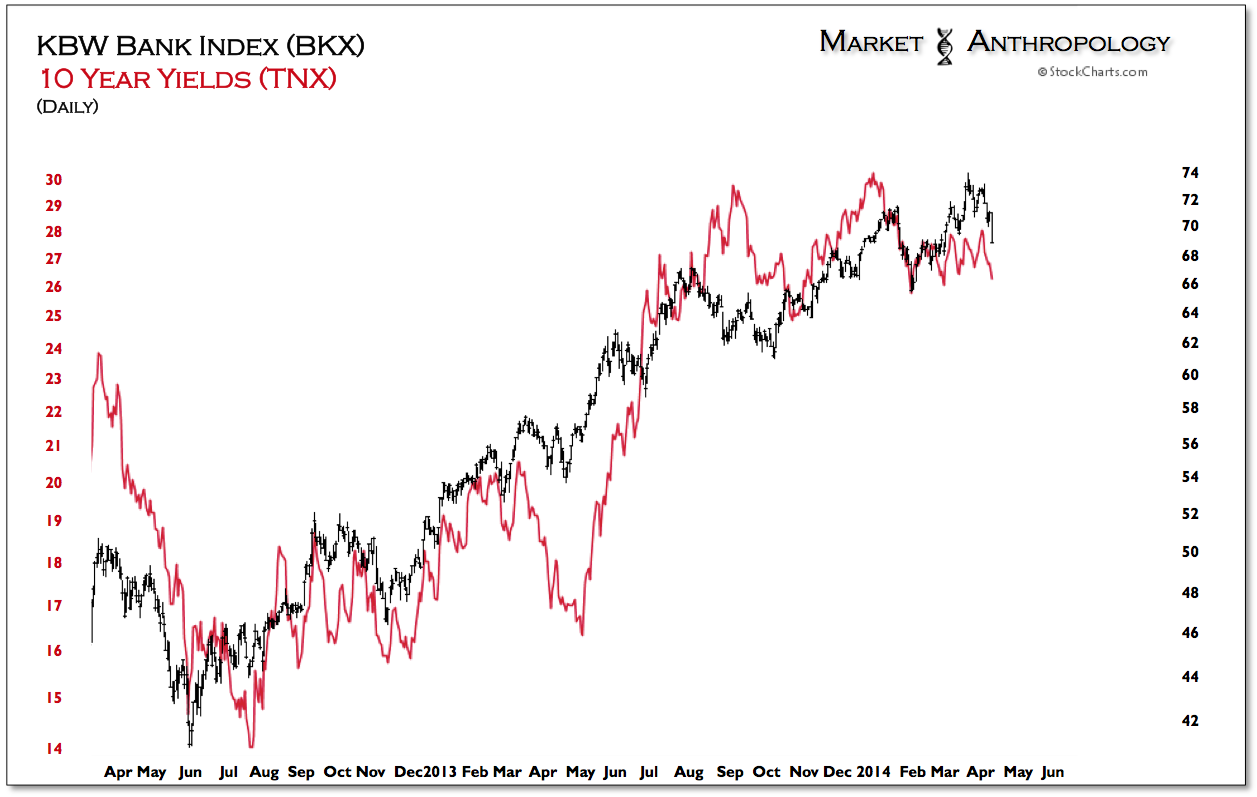
As the banks (already down ~ 4.0% for the week) get hit once again this morning on the back of considerably weaker then expected quarterly profits from JP Morgan (NYSE:JPM), the downside catalyst will only reinforce the trend and negative divergence that long-term yields had pointed towards in the financial sector over the past few weeks.

An inverse to last years sentiment and structure, participants need to yield their considerably misgiven perspectives to yields. Those that have followed our work over the past four months (see here) will know that this has been a major theme and imbalance that we have positioned off of.  

Closing out an important and powerful week, we updated several different ongoing series.  
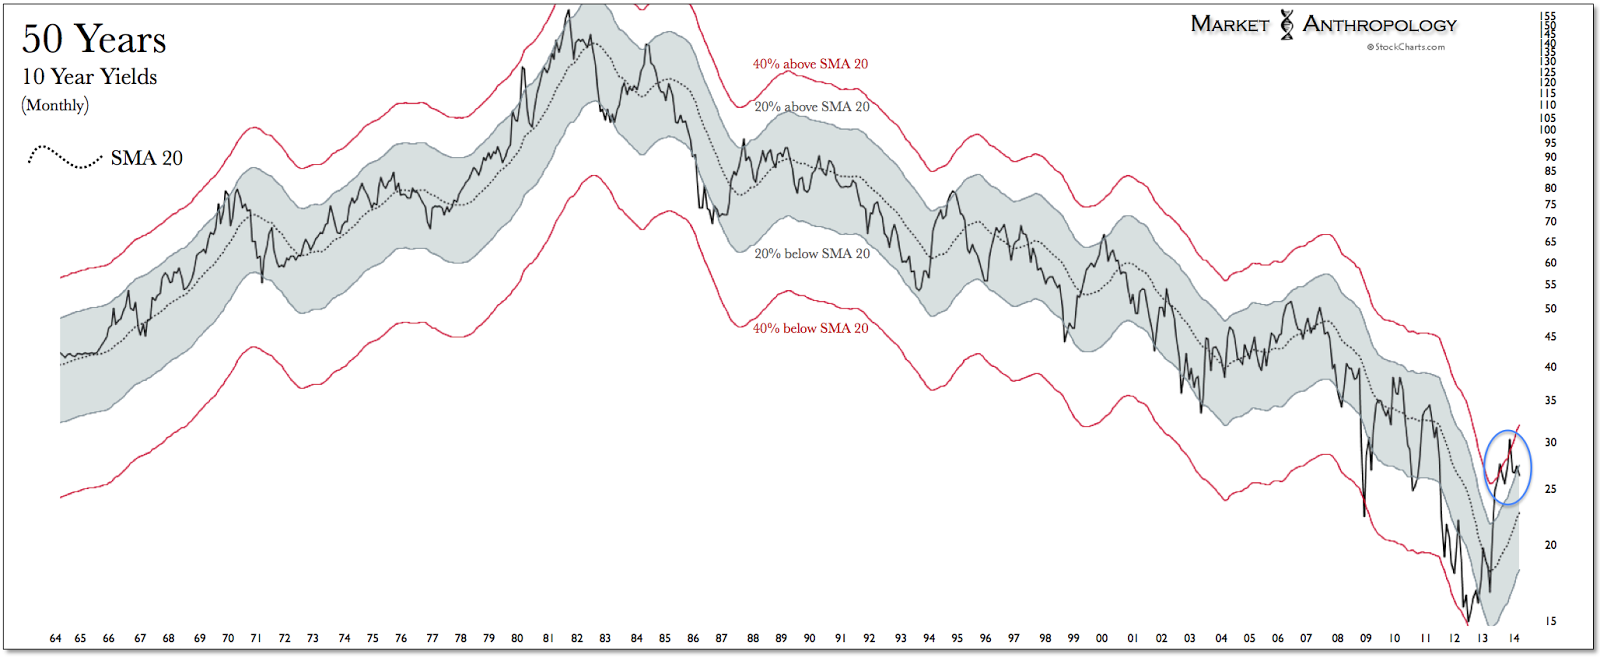
50 Years of 10-Year Yields, Monthly View
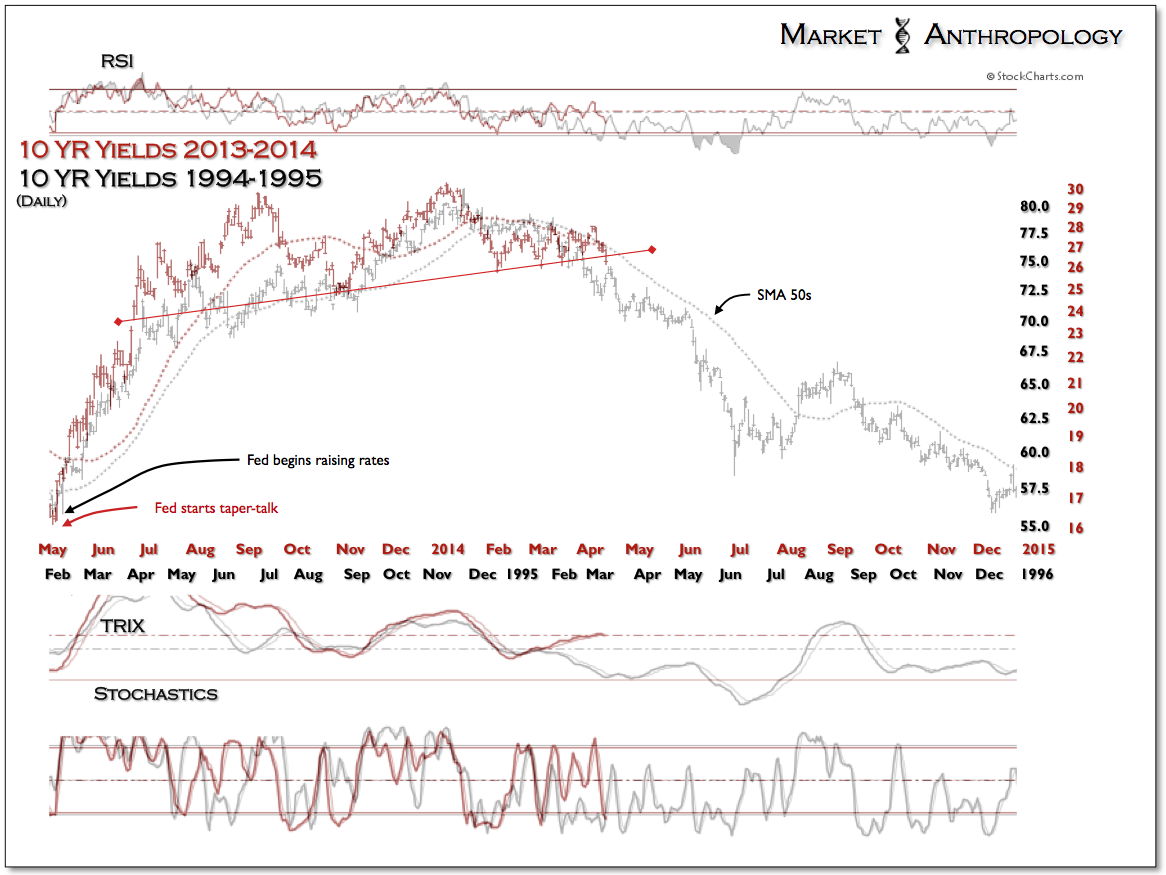
Comparative 10-Years: 2013-2014 vs 1994-1995
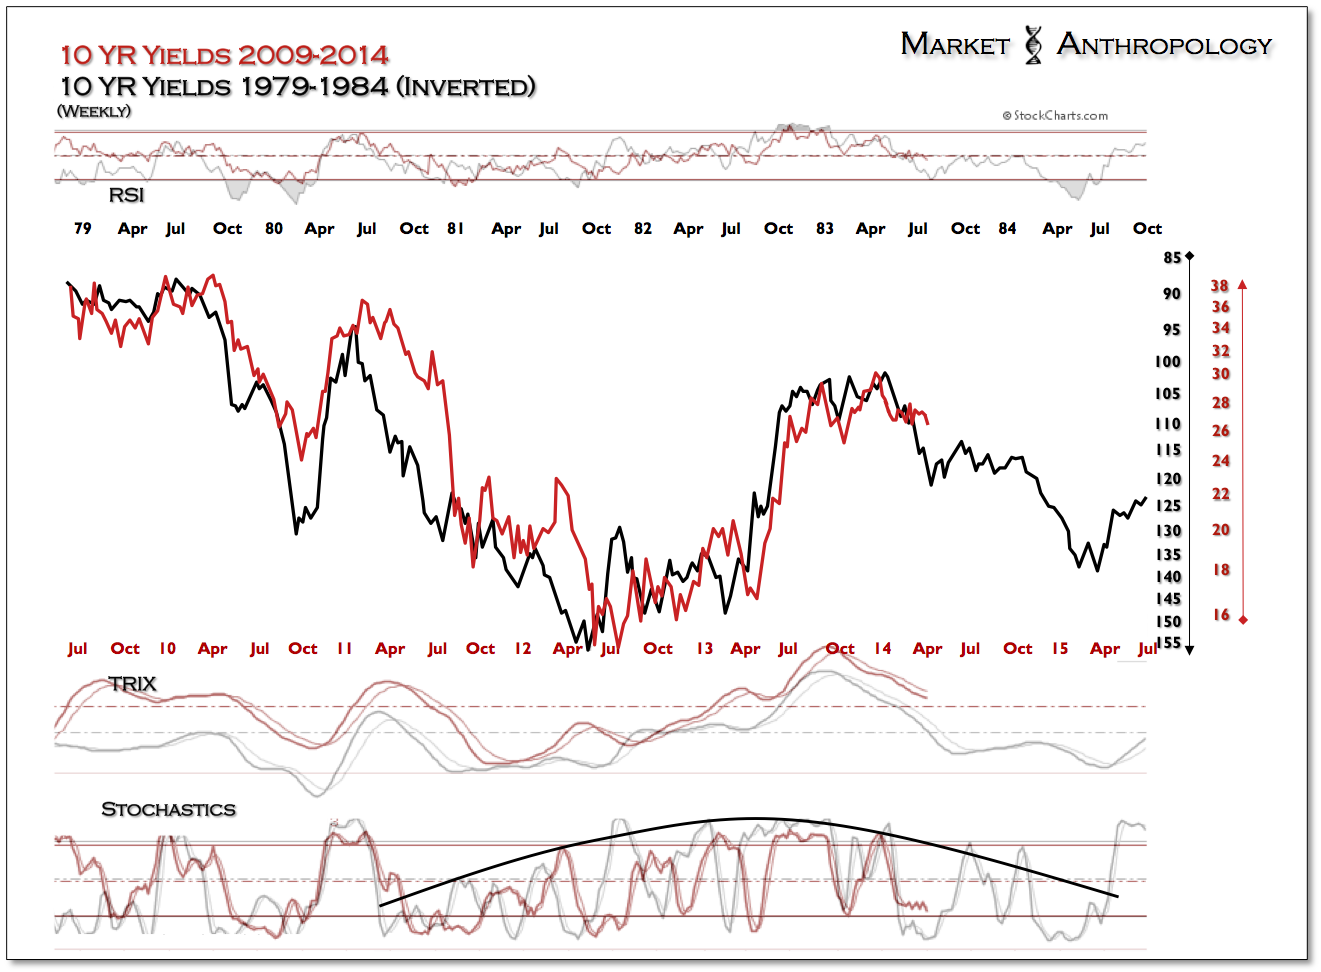
10-Y Yields 2009-2014 vs 1979-1984 (Inverted)
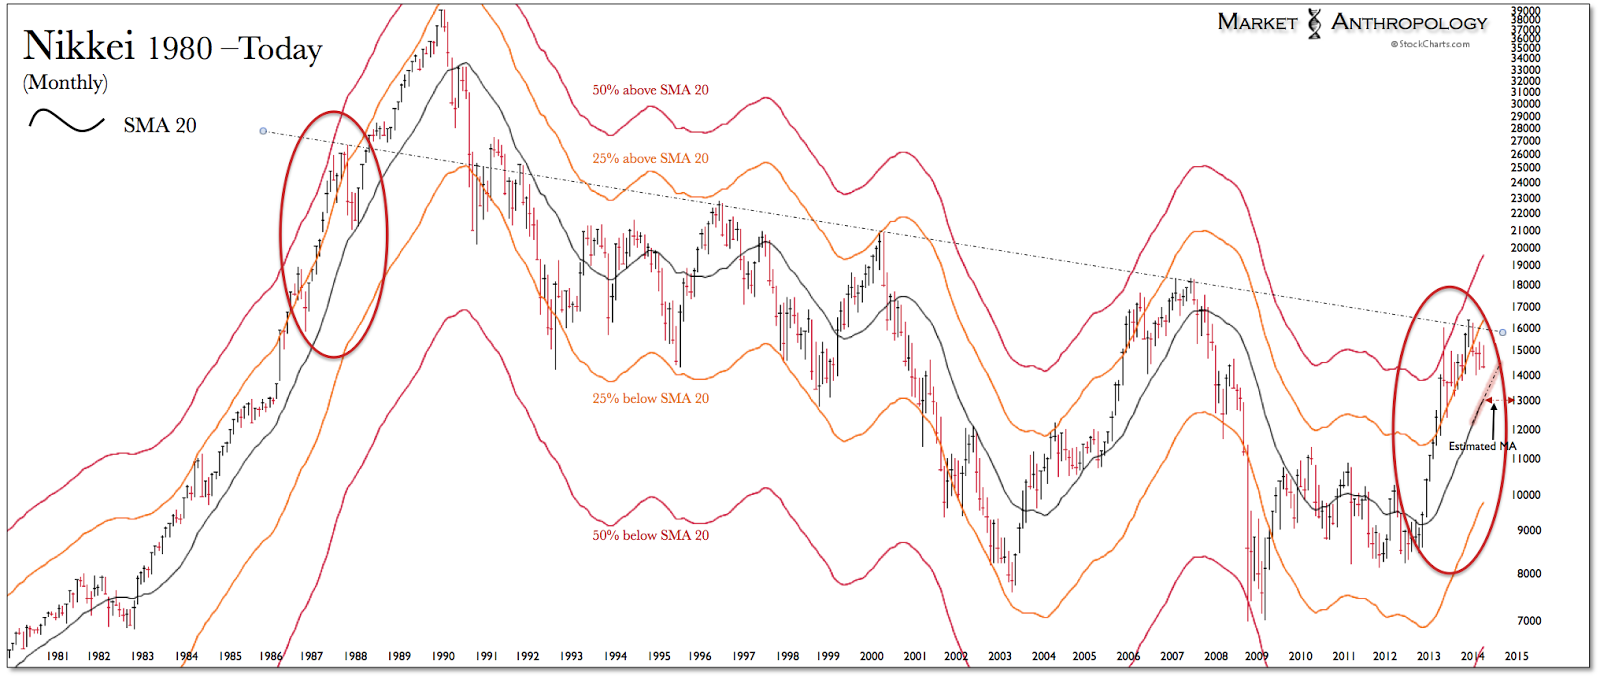
Nikkei Monthly 1980-Today
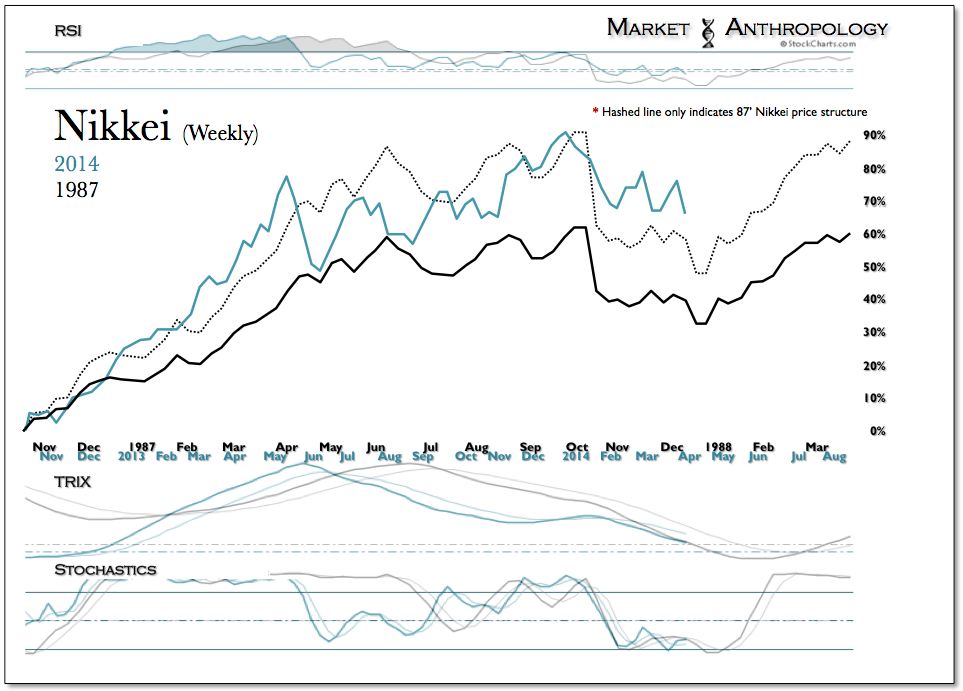
Nikkei Weekly 1987 vs 2014
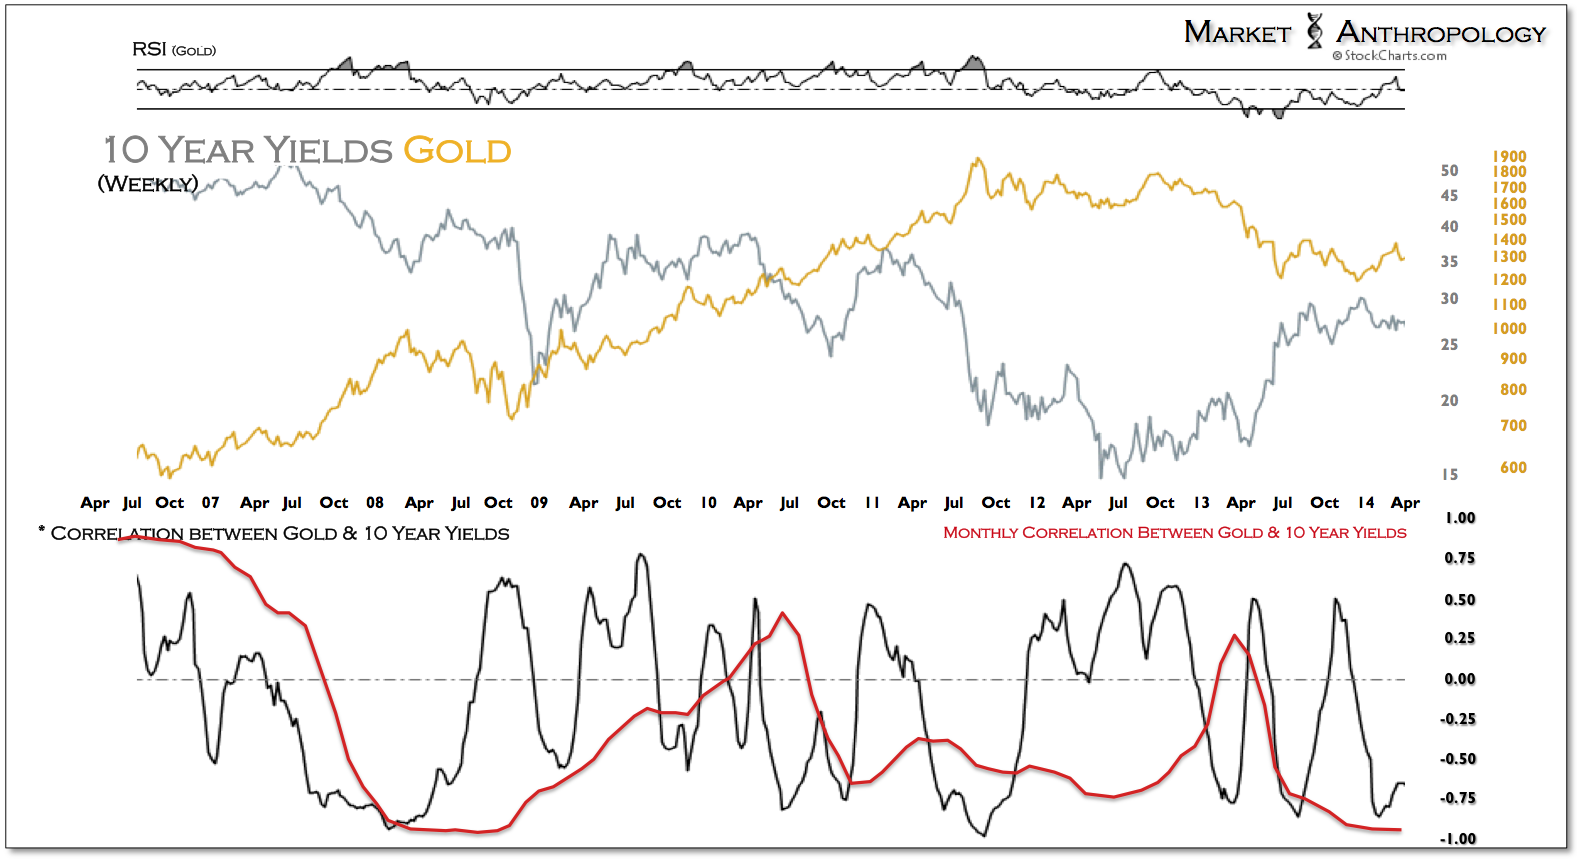
10-Y Yields vs Gold Weekly
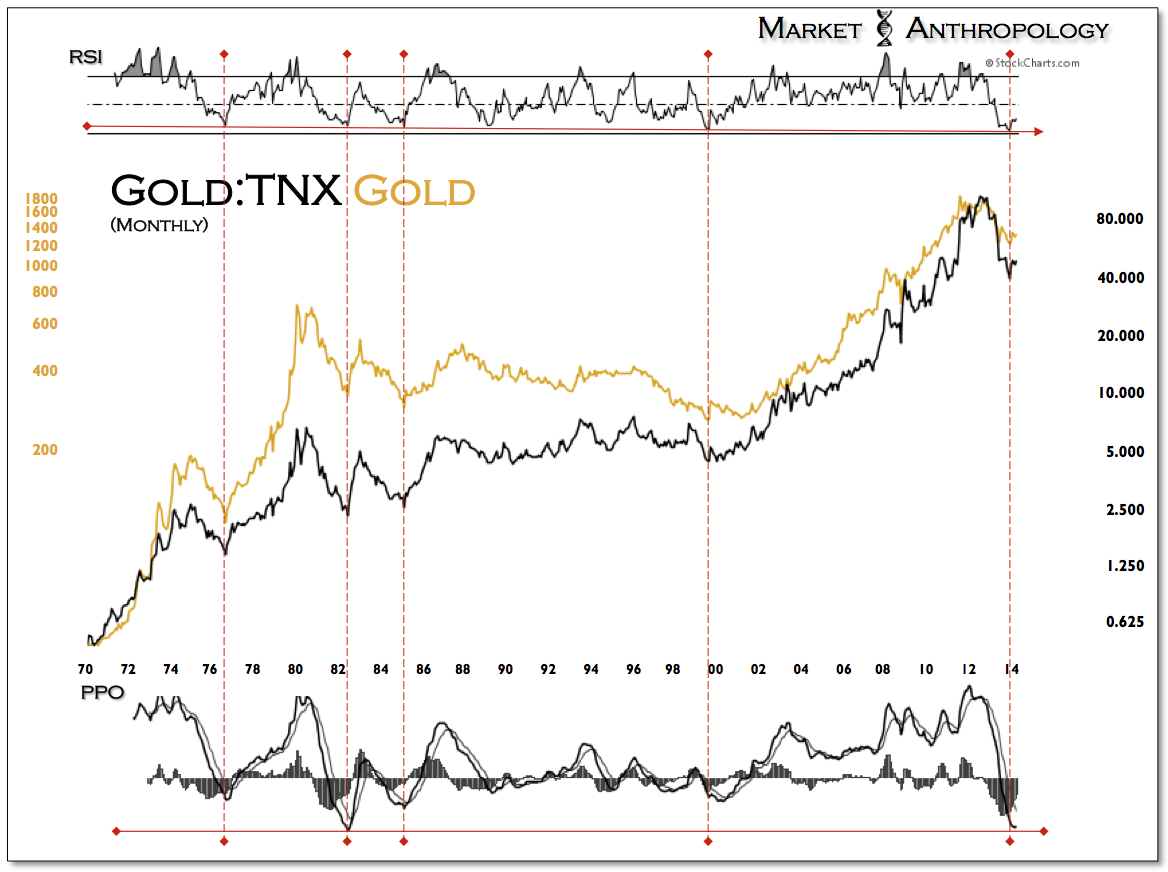
TNX vs Gold Monthly
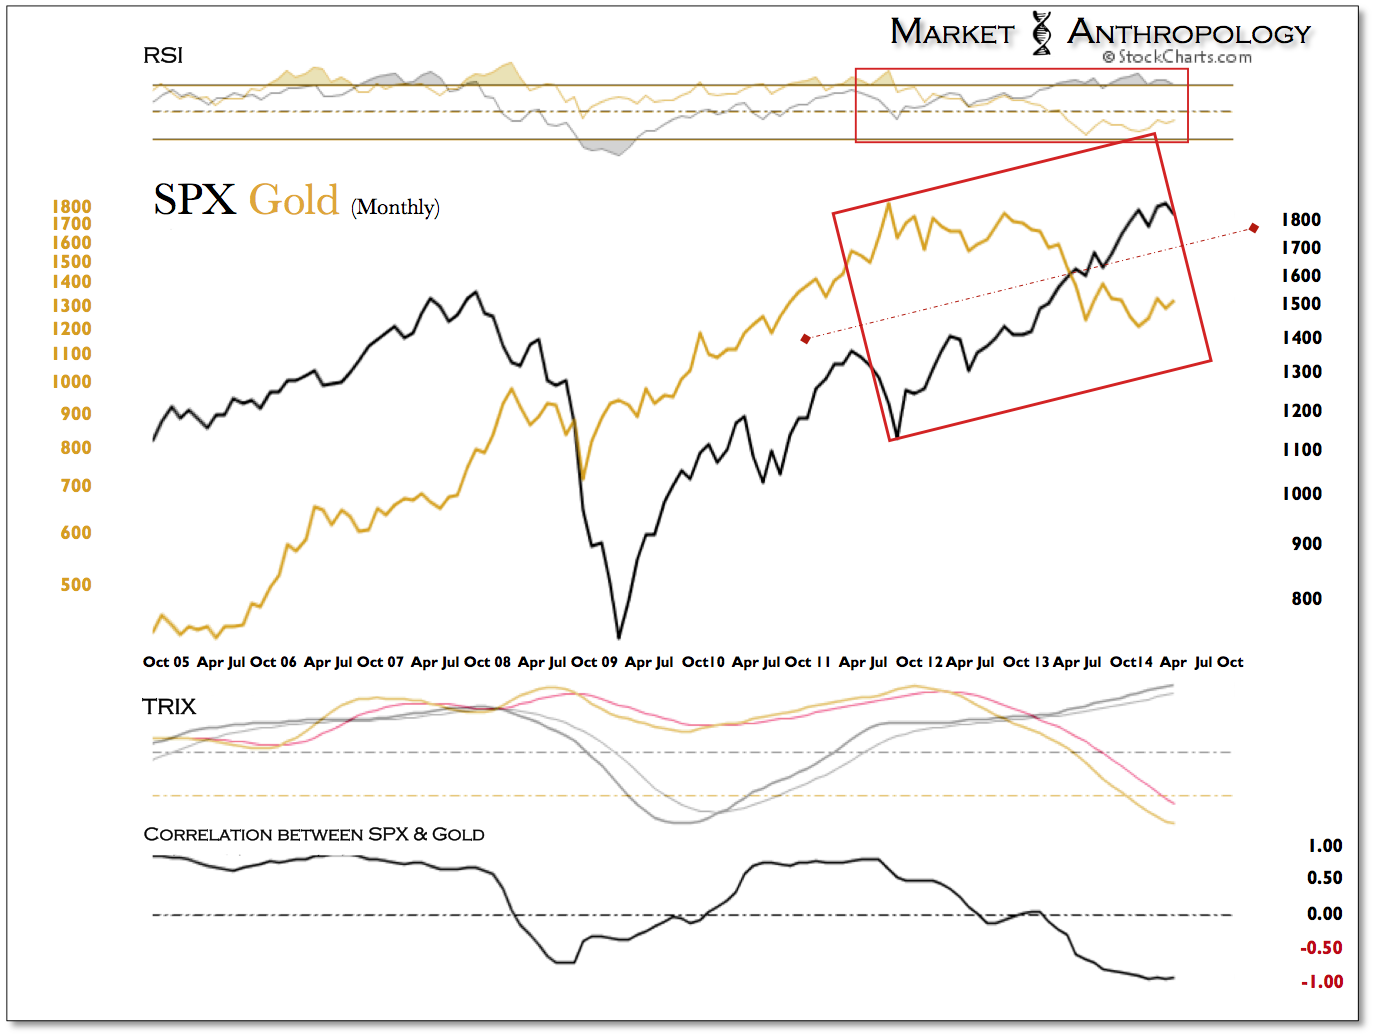
SPX vs Gold Monthly
BKX vs TNX (Daily)
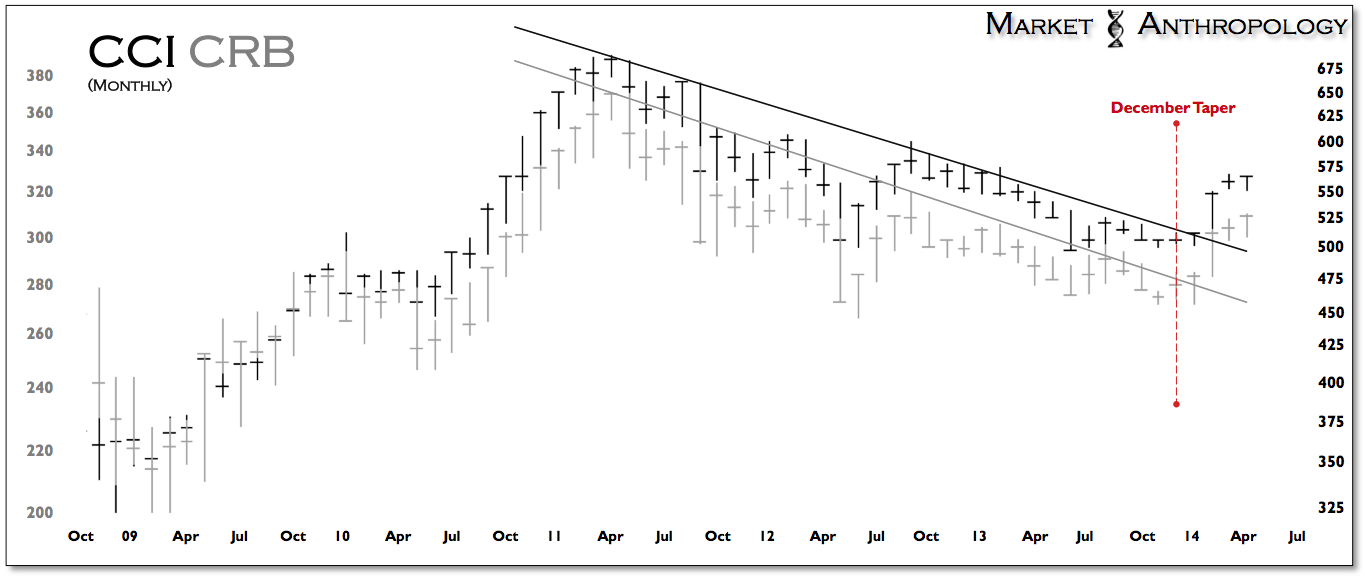
CCI vs CRB Monthly
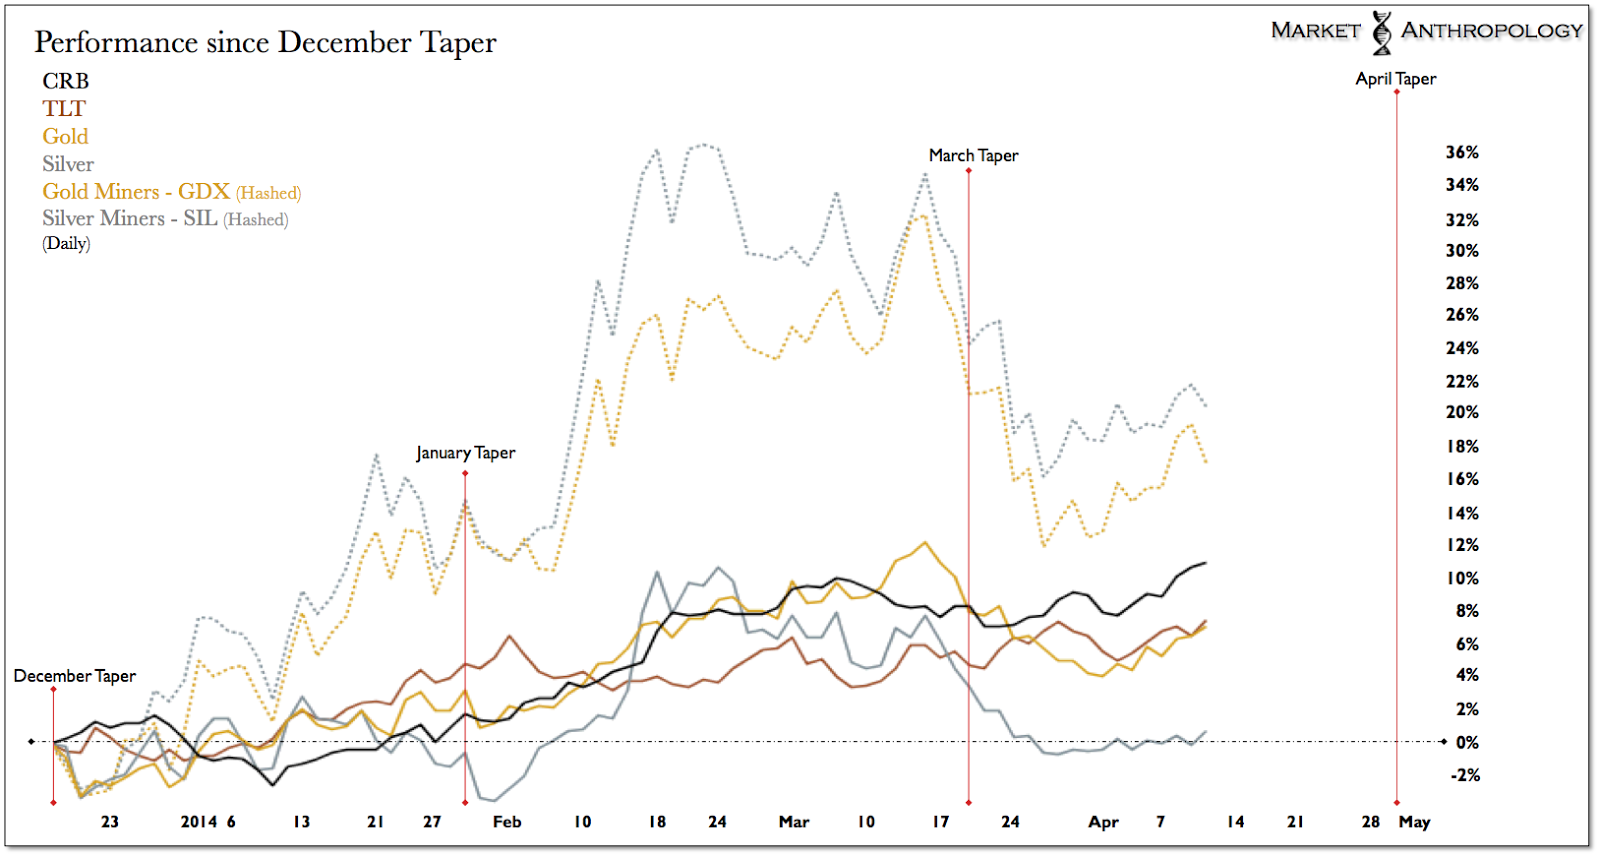
Performance since December Taper: Various Instruments Daily
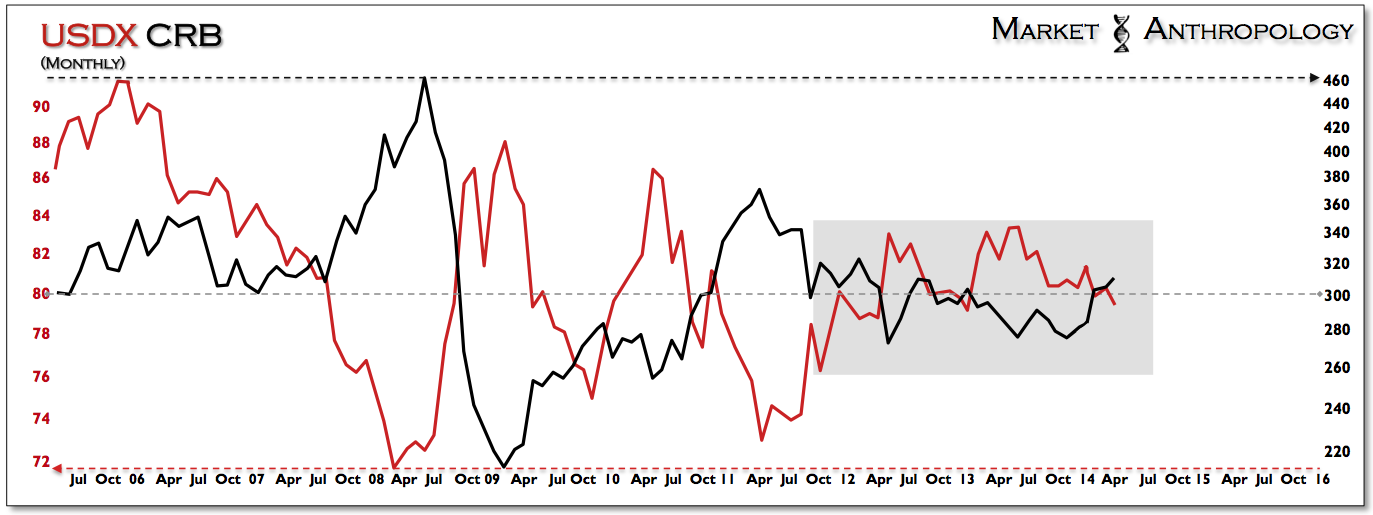
USDX vs CRB Monthly
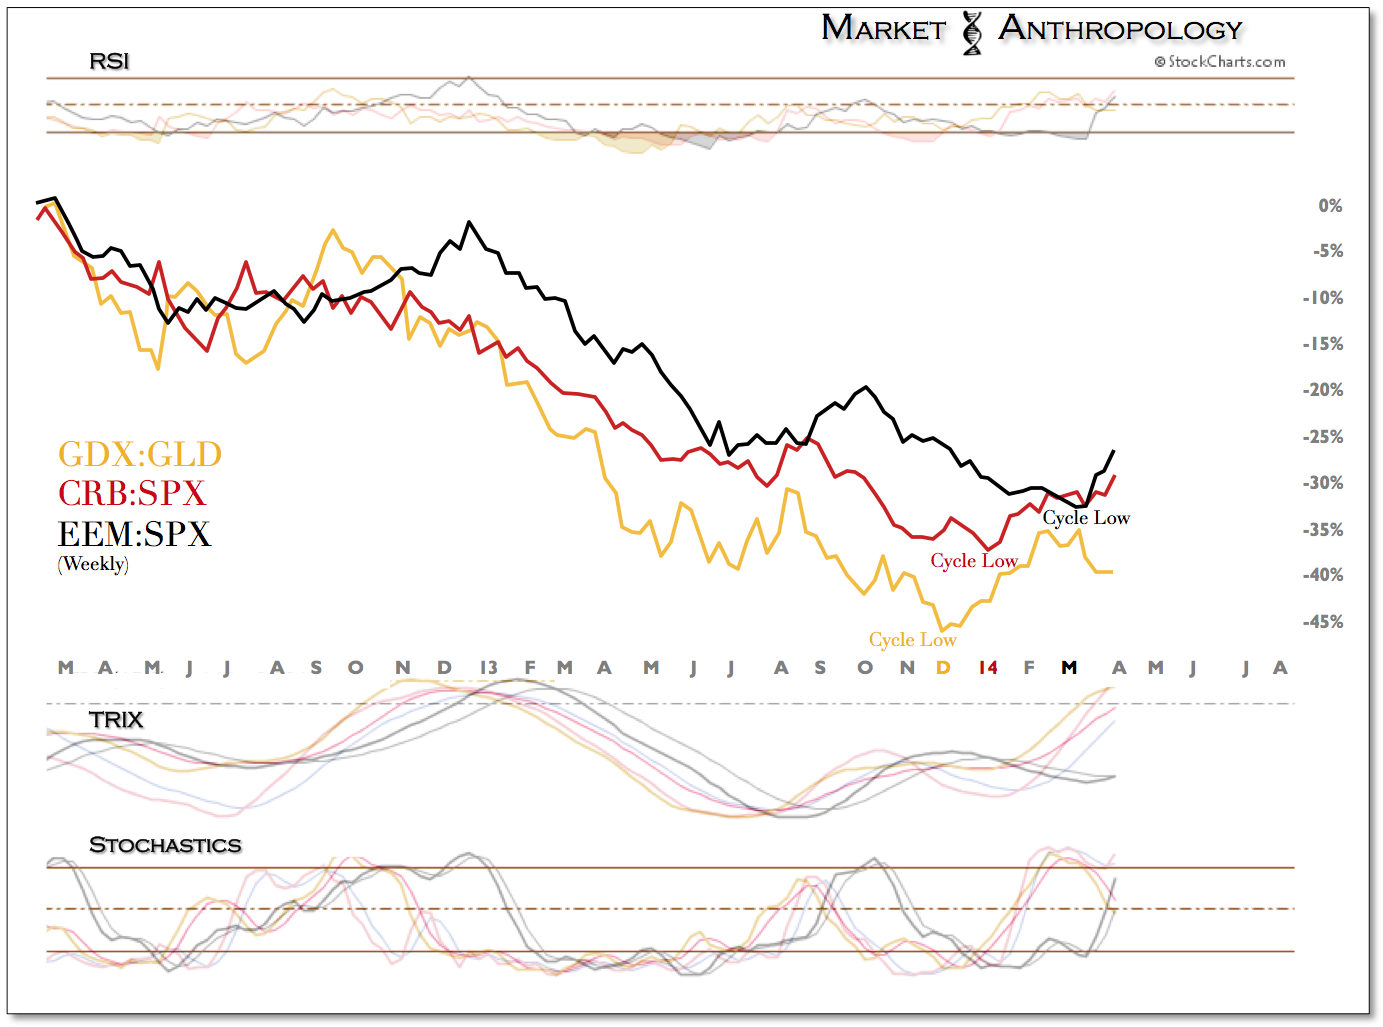
GDX vs Gold, CRB vs SPX, EEM vs SPX (Weekly)
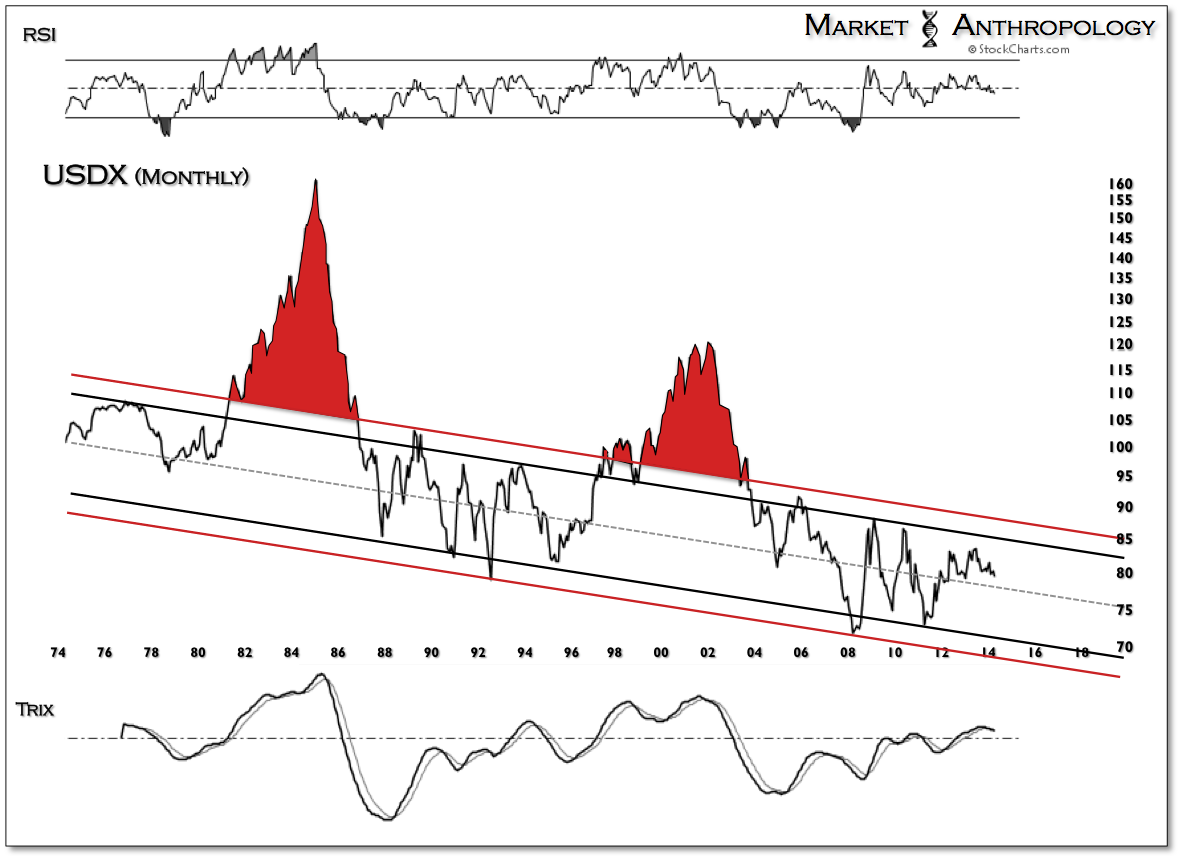
USDX Monthly
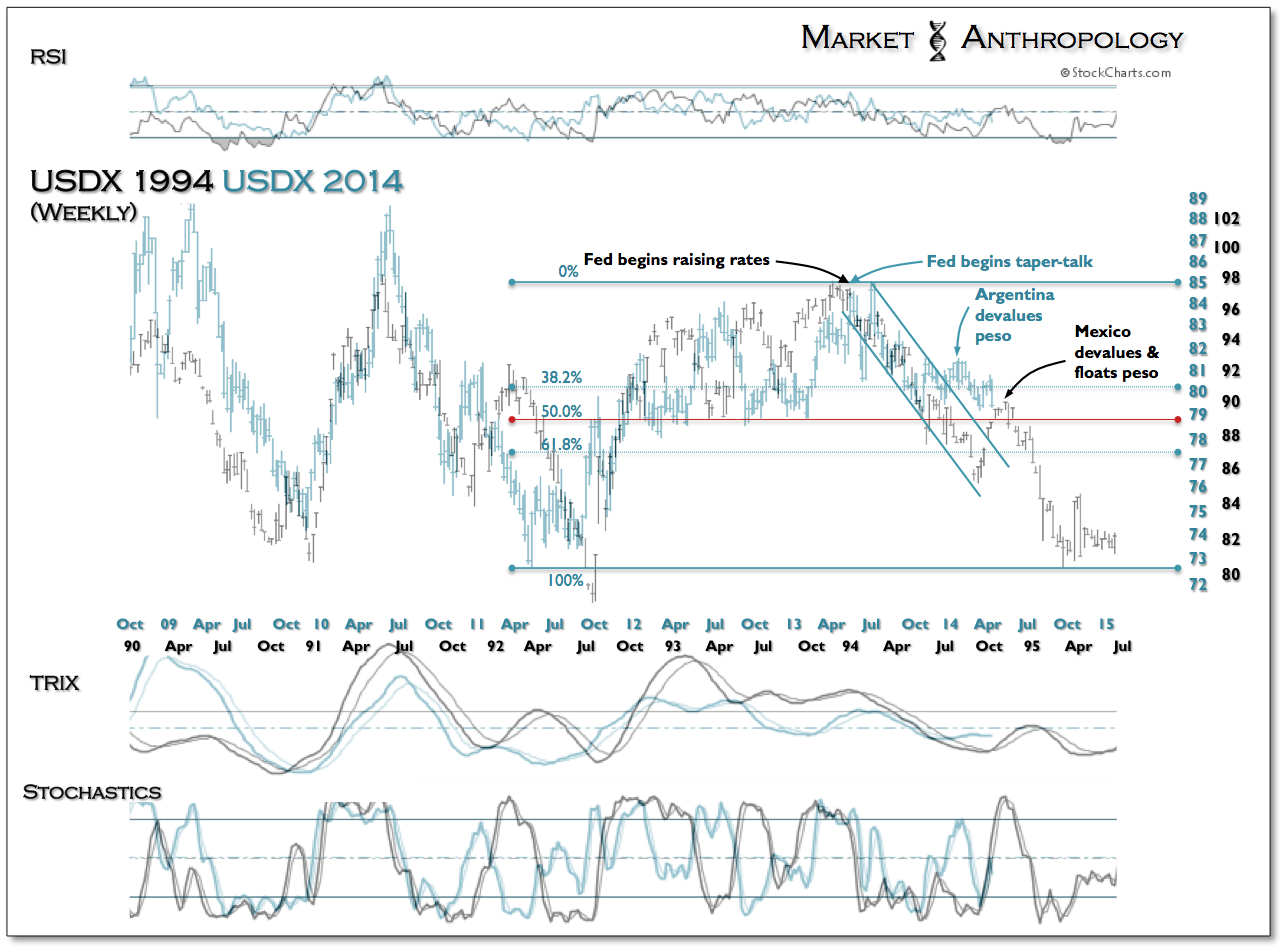
USDX 1994 vs 2014 (Weekly)
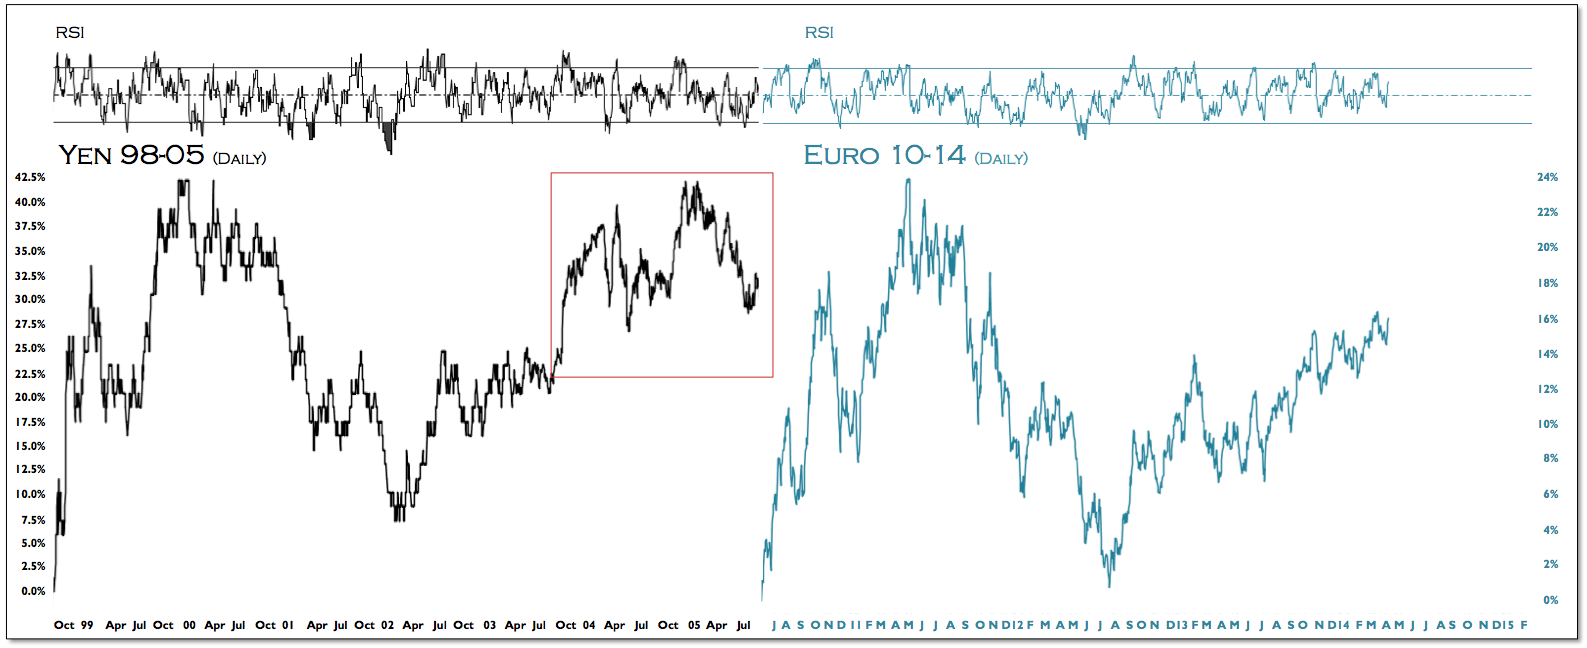
Yen vs Euro Daily
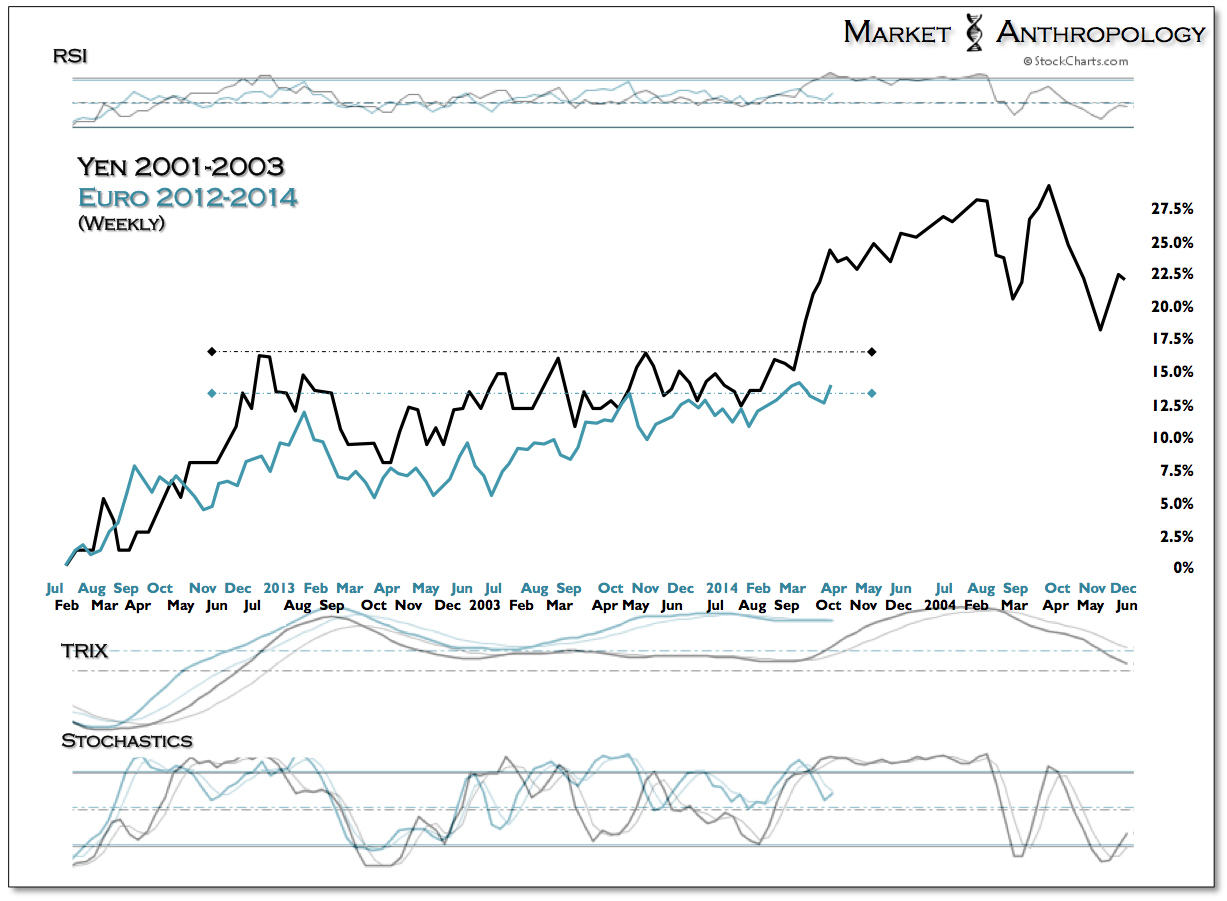
Yen 2001-2003 vs Euro 2012-2014 Weekly
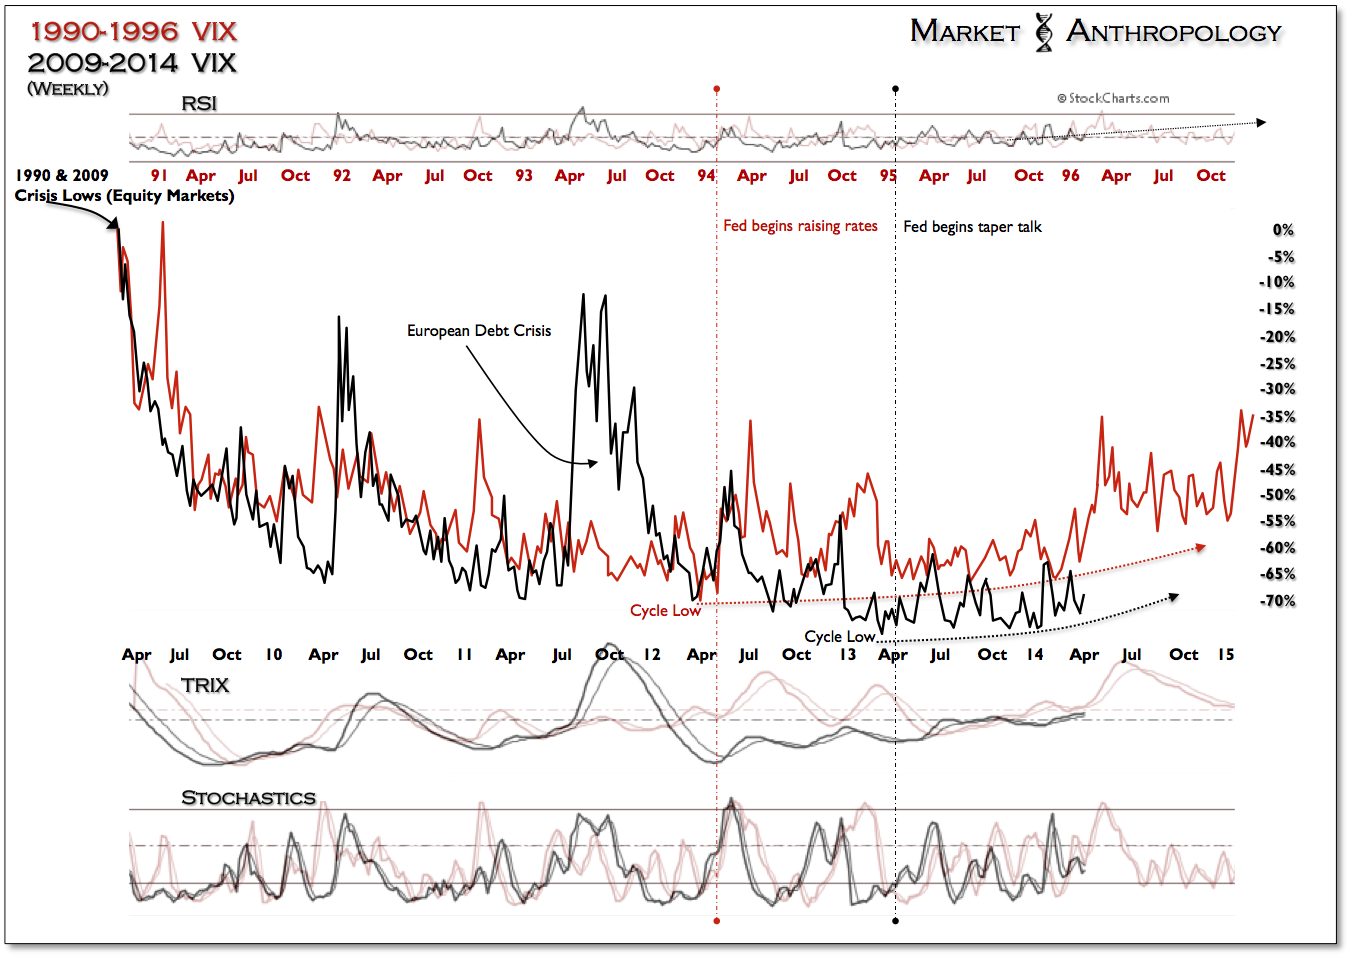
VIX: 1990-1996 vs 2009-2014 Weekly
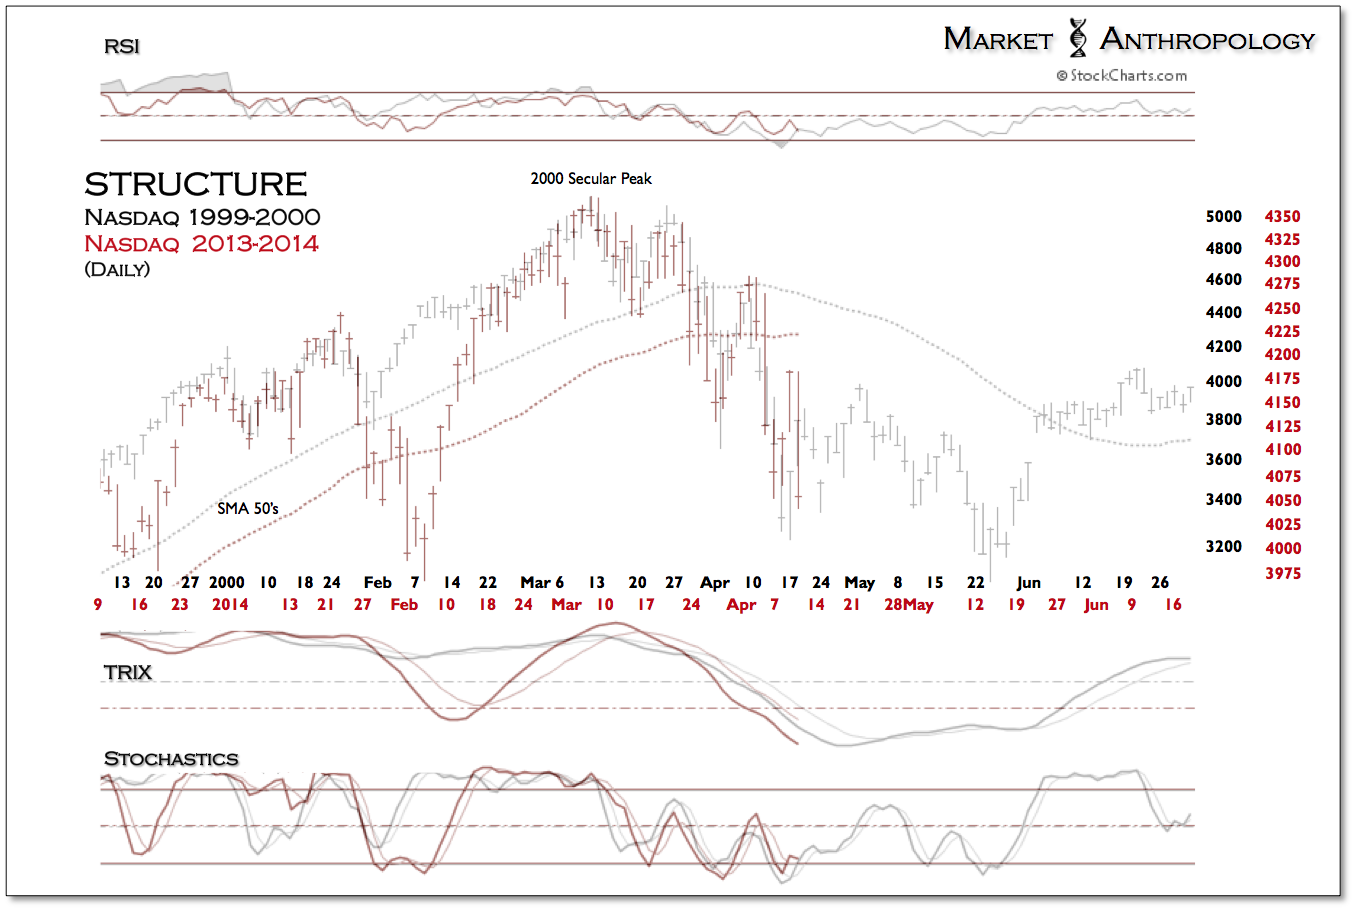
Nasdaq 1999-2000 vs 2013-2014 Daily
Chart 21
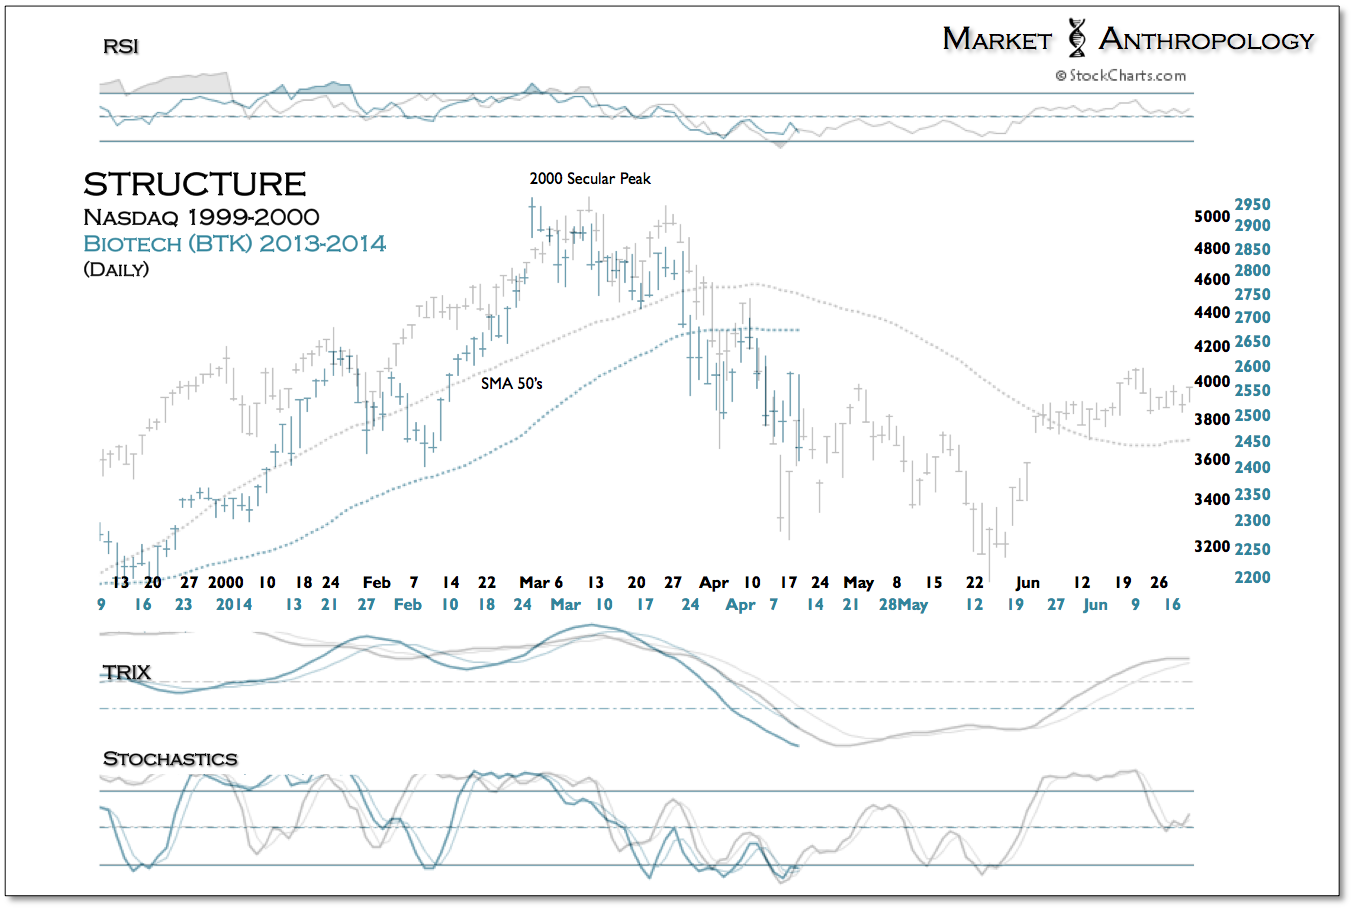
Dasdaq 1999-2000 vs BTK 2013-2014 Daily
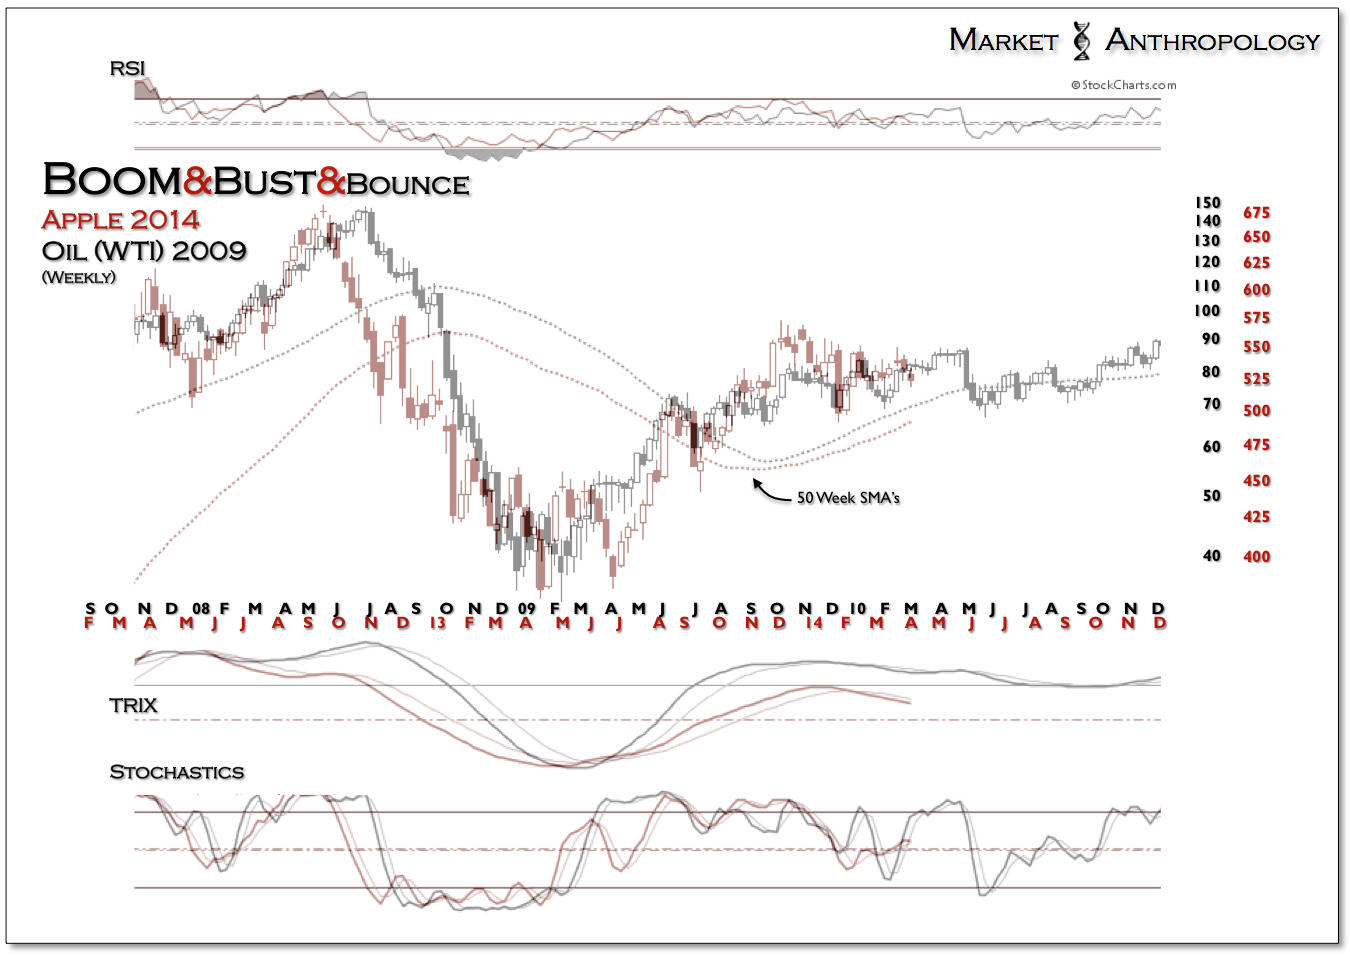
Apple 2014 vs WTI 2009 Weekly
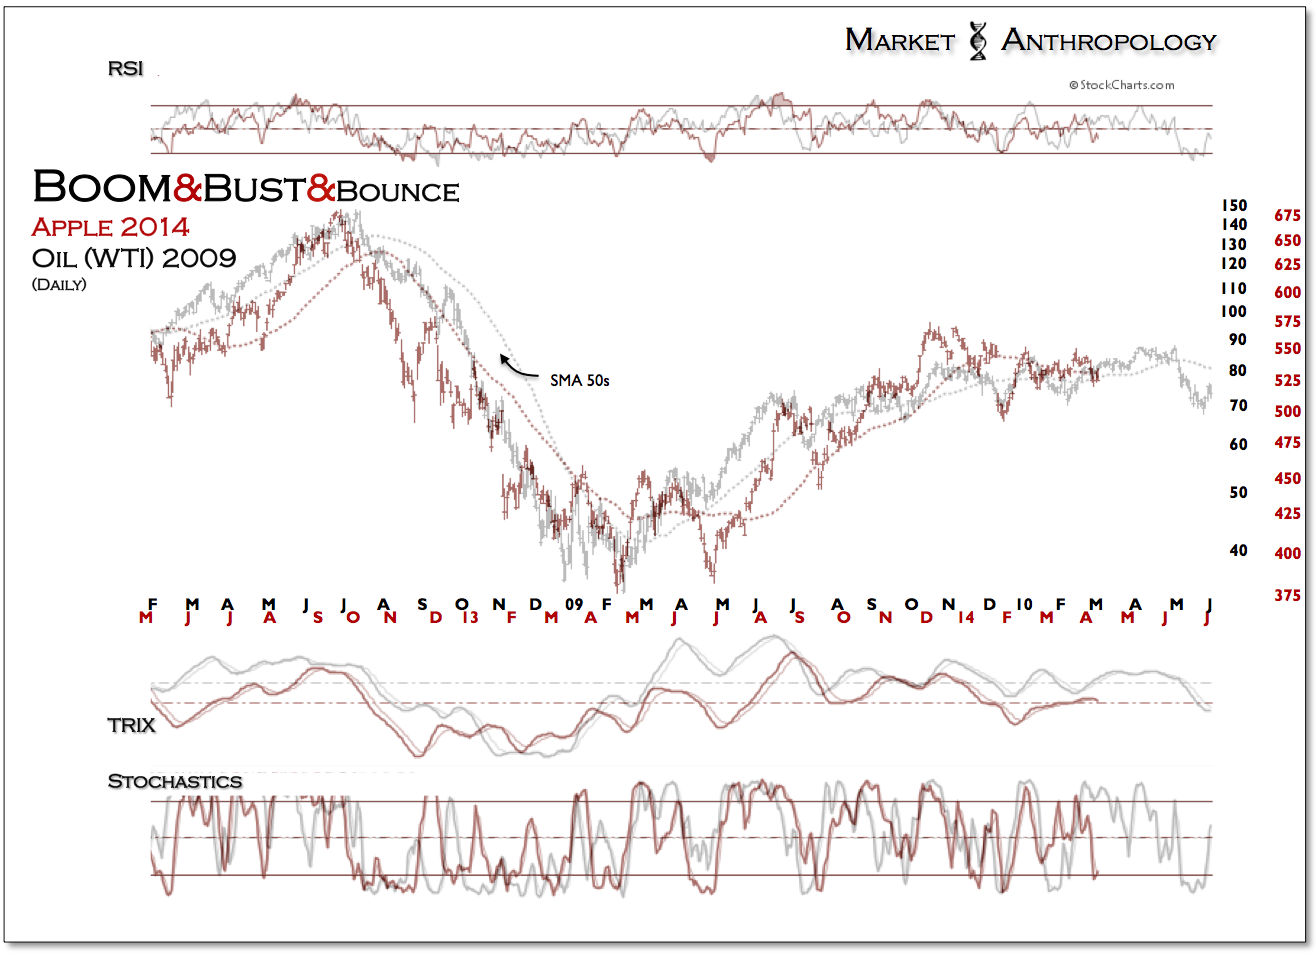
Apple 2014 vs WTI 2009 Daily

Latest comments

Risk Disclosure: Trading in financial instruments and/or cryptocurrencies involves high risks including the risk of losing some, or all, of your investment amount, and may not be suitable for all investors. Prices of cryptocurrencies are extremely volatile and may be affected by external factors such as financial, regulatory or political events. Trading on margin increases the financial risks.
Before deciding to trade in financial instrument or cryptocurrencies you should be fully informed of the risks and costs associated with trading the financial markets, carefully consider your investment objectives, level of experience, and risk appetite, and seek professional advice where needed.
Fusion Media would like to remind you that the data contained in this website is not necessarily real-time nor accurate. The data and prices on the website are not necessarily provided by any market or exchange, but may be provided by market makers, and so prices may not be accurate and may differ from the actual price at any given market, meaning prices are indicative and not appropriate for trading purposes. Fusion Media and any provider of the data contained in this website will not accept liability for any loss or damage as a result of your trading, or your reliance on the information contained within this website.
It is prohibited to use, store, reproduce, display, modify, transmit or distribute the data contained in this website without the explicit prior written permission of Fusion Media and/or the data provider. All intellectual property rights are reserved by the providers and/or the exchange providing the data contained in this website.
Fusion Media may be compensated by the advertisers that appear on the website, based on your interaction with the advertisements or advertisers.
© 2007-2024 - Fusion Media Limited. All Rights Reserved.