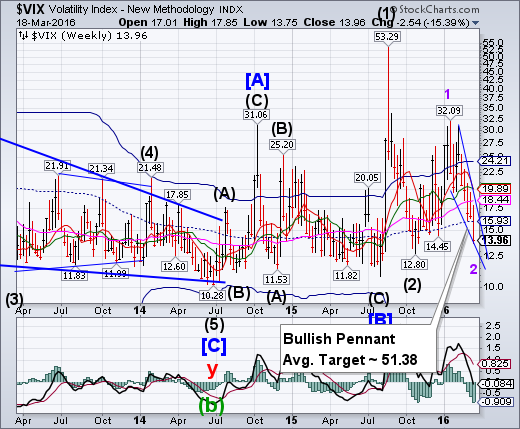
VIX declined beneath weekly mid-Cycle support at 15.93, making a new Master Cycle low. The Cycles Model suggests VIX may begin to rally next week. An aggressive buy signal (NYSE sell signal) may be made with a rally back above mid-Cycle resistance.
(AFR) Even as a gauge of investor anxiety hovers close to the lowest level of 2016, the calm washing over the US stock market has a suspicious feel to some traders.
The concern is visible in the record number of shares outstanding in an exchange-traded note betting on an increase in the Chicago Board Options Exchange Volatility Index. Share counts, which rise along with demand for ETFs, sit around the highest levels of the year for two other long-VIX securities, according to data compiled by Bloomberg. Meanwhile, the fear gauge has closed below 20 for 10 straight days, the longest such streak since December.
SPX closes above the 4.3-year trendline.
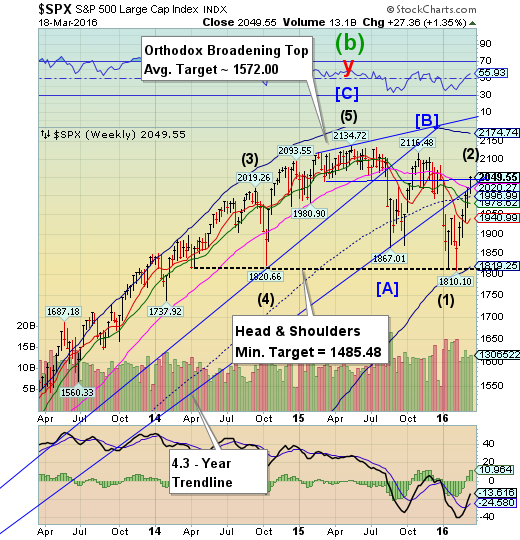
The SPX made another attempt at its 4.3-year trendline at 2025.00, closing above it. This trendline was originally broken on January 6, in the decline to the January 20 low. Trendlines are important support areas that often attract, then repel the markets. The boost above the trendline was made during options expiration and may be short-lived.
(ZeroHedge) Flip-flopping Fed President Jim Bullard has done it again. Having helped spark the recent ramp in mid-Feb with his uber-dovish comments that "tightening was unwise," he now expresses his hawkish opinion - with stocks back nearer record highs - that it would be "prudent policy to edge rates toward normal levels." Is that a "sell'?
NDX ends week beneath Long-term resistance.
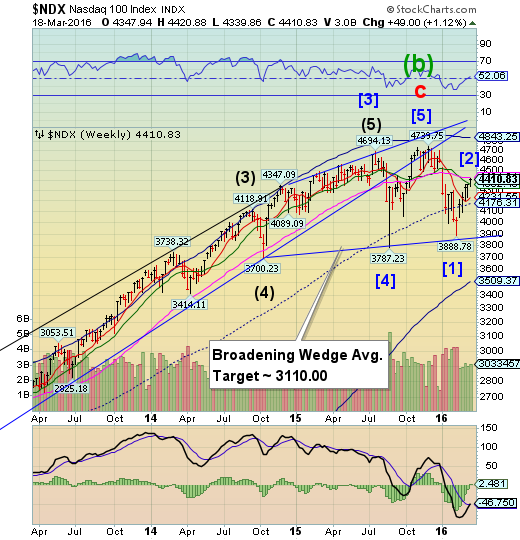
NDX closed beneath weekly Long-term resistance at 4421.81, completing a 62.5% retracement. Should it decline beneath weekly Intermediate-term support at 4362.20, NDX maybe on a sell signal.
(ZeroHedge) While "most shorted" stocks have ripped higher in the last few weeks, and "weak balance sheet" stocks have soared, the real winner in this "dash for trash" is... garbage!!
It appears investors can't get enough of "Waste and Disposal" stocks...
High Yield Bond Index makes a new high.
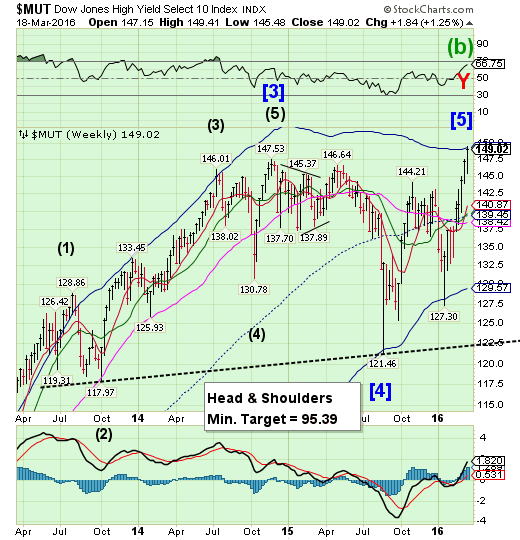
The High Yield Index has reached its Cycle Top resistance at 149.83 as investors search for yield. The retracement from the next decline may not be as generous.
(MarketRealist) High yield bond issuance rose last week as the stock Market improved due to the rise in oil prices. In mid-February, yields started falling, and issuers flocked to the high yield bond market. Further, market participants were closely watching for clues about a possible interest rate hike in the Federal Open Market Committee (or FOMC) meeting, which ended on March 16, 2016.
According to data from S&P Capital IQ/LCD, dollar-denominated high yield debt amounting to $4.1 billion, the highest in 2016 so far, was issued in the week ending March 11. In the previous week, high yield issuance stood at $3.7 billion. The number of transactions was up to six last week from three in the previous week. Last week brought the total US dollar-denominated issuance of high yield debt to $20.8 billion in 2016. This is 72.0% lower than the issuance in the corresponding period of 2015.
The euro is rising again.
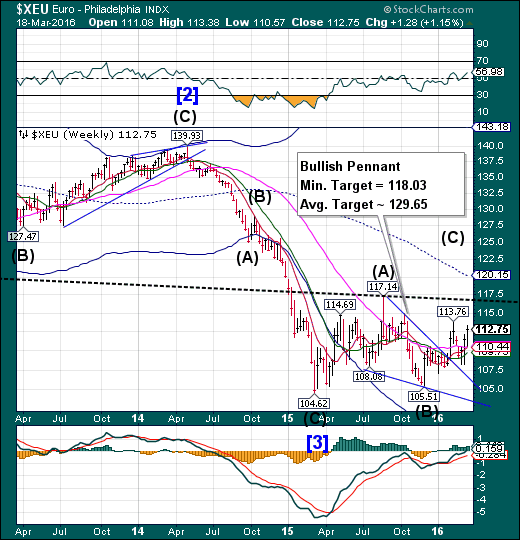
The euro retested Long-term resistance at 110.44 before launching higher. The Cycles Model suggests a period of strength has begun and may continue through the end of the month with the minimum Pennant target in reach.
(ZeroHedge) Not everyone was delighted by Mario Draghi's decision on March 10 begin monetizing corporate bonds: chief among them was Bundesbank president Jens Weidmann whose opposition to unorthodox monetary policies is well known, and whose "Northern Block" was among those voting against the ECB's QE expansion (Weidmann himself was not among those voting last week). Of course, complaining about it does not mean stopping it, and for three years now the "Germans" on the ECB council have complained loudly even as the ECB is on track to double its balance sheet in the next few years.
And, as is customary, after every dramatic easing step by the ECB, Weidmann takes to the media to express his frustration with the ECB's ever bolder attempts to recreate Weimar, something the German press has repeatedly made clear is not welcome:
EuroStoxx fails at trendline resistance.
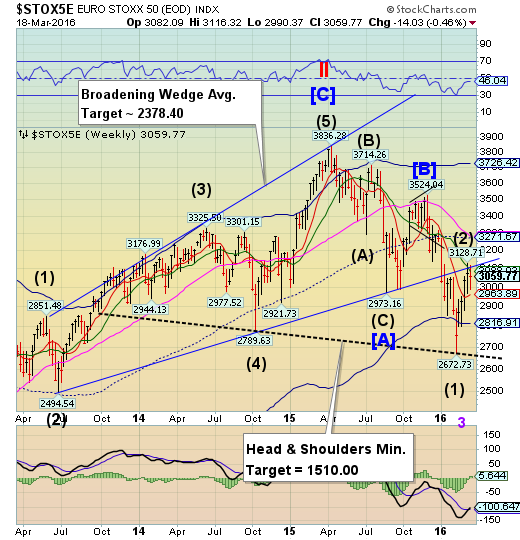
EuroStoxx choked at the trendline of the Broadening wedge formation and Intermediate-term resistance at 3088.92 before closing lower in an inside week. Failure at these resistance levels may signal a change in trend, while crossing beneath Short-term support at 2963.89 confirms a probable sell signal. The Head & Shoulders neckline defines the potential magnitude of the decline.
(WSJ) Eurozone stocks have had a bad year– but that’s not deterring fund managers, who continue to rate the region as the world’s most favorable.
While the Euro Stoxx 50 is down around 6% for 2016, global fund managers grew more bullish on eurozone equities over the past month.
A Bank of America Merrill Lynch (NYSE:BAC) survey found net 41% of fund managers were overweight eurozone equities in early March, a measure that subtracts underweight from overweight positions. A month earlier, that figure was net 36%.
The yen broke out higher.
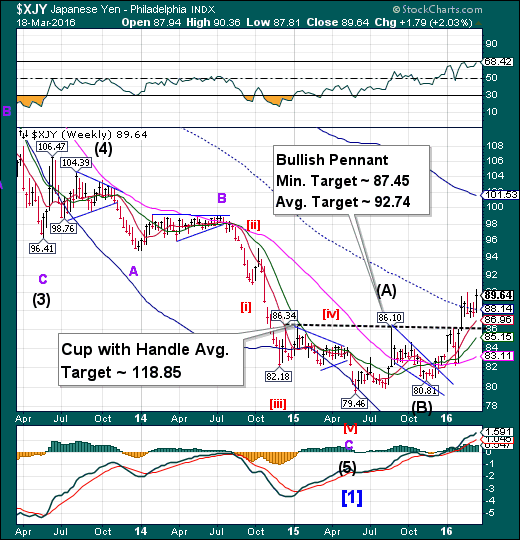
The yen broke out of its consolidation, making a new 18-month high. The expected strong period of strength expected a week ago has arrived. This episode of strength may last through the end of March. The next target appears to be the average for the Bullish Pennant, but it may not stop there.
(Barrons) The Bank of Japan last week backpedaled on its experiment with negative interest rates. The central bank’s Governor Haruhiko Kuroda rebutted foreign criticism that the BOJ’s loose monetary policy was aimed at lowering the yen’s value. The bank, he insisted, “doesn’t target exchange rates.”
Kuroda’s statement was greeted with skepticism by analysts, who frankly want a weaker yen to spur economic growth and help stocks. The central bank cut the rate on some bank reserves into negative territory in January precisely to devalue the yen, argues CLSA strategist Nicholas Smith. Over the long term, however, the yen has moved in just one direction, up. On a trade-weighted basis, it has more than tripled since its free float in 1971, soaring toward 75 per dollar in 2012.
The Nikkei challenges mid-Cycle resistance, reverses.
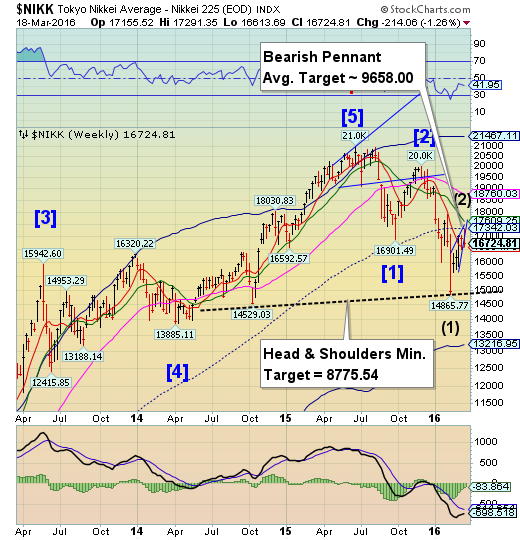
The Nikkei stalled again beneath mid-Cycle resistance at 17342.03 on Monday and appears to have reversed lower. The Cycles Model suggests that the rally may be over with at least another week of decline ahead. Crossing the neckline may be instructive regarding its ultimate target.
(Barrons) While the rest of the world is partying over the Federal Reserve‘s dovish tone on rate hikes, Japan is slipping away.
The Nikkei 225 falls for a 4th day, down 1.6% this morning in Tokyo, as the Japanese yen rose 0.36% to 111.03. Overnight, the yen fell to as low as 110.67 per dollar.
The Bank of Japan is obviously worried about soaring yen. A stronger yen ties business executives’ hands to raise wages and move investments back home.
The Wall Street Journal‘s Kosaku Narioka reported that BoJ was checking yen rates during the U.S. trading hours overnight – a prelude to currency intervention?
U.S. dollar is now making new lows.
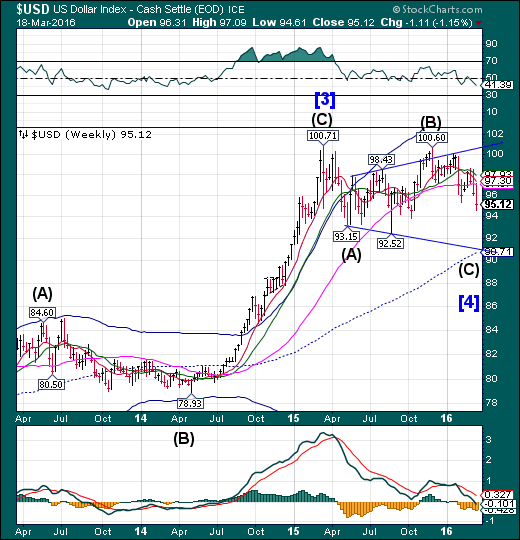
USD retested Long-term support at 97.07 before selling off to make new lows. The Cycles Model suggests along decline may follow, perhaps lasting through mid-May. It may finally turn traders bearish the dollar. The ultimate target for USD may be the weekly mid-Cycle support at 90.71.
(BusinessInsider) The US dollar can’t take a trick at present. Courtesy of a sharply stronger Chinese yuan, the greenback is yet again on the ropes in Asia.
The People’s Bank of China “fixed” Friday’s USD/CNY rate at 6.4628, well below Thursday’s fixing level of 6.4961. The 333 pip decline was the strongest one-day strengthening in yuan’s starting level since November 2015.
Not only that, as this tweet from IG Markets chief market strategist Chris Weston notes, the 0.5% strengthening was the third largest daily percentage increase on record.
USB may be ready for a reversal.
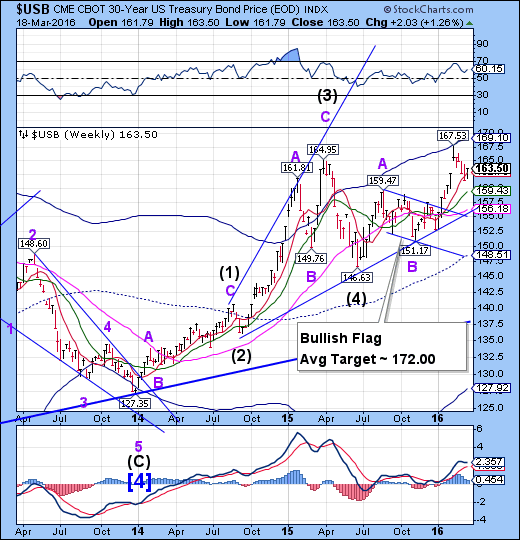
The Long Bond challenged Short-term support at 162.76 a second time before closing above it. This was an inside week, but USB closed higher for the week, indicating the direction of a probable breakout. Over the next week or two we’ll be looking for the 34.4-year high in Treasuries.
(Reuters) U.S. Treasuries prices rose for a fifth straight session on Friday, in line with gains in European sovereign markets, as investors continued to snap up U.S. government bonds with the expectation that the Federal Reserve will undertake fewer rate increases this year.U.S. benchmark 10-year Treasury note yields, which trade inversely to prices, had their largest weekly drop since mid-February. U.S. two-year note yields, on the other hand, posted their steepest weekly fall since October 2014.
The Fed's interest rate forecast, or the so-called "dotplots," showed just two rate increases in 2016. In contrast, at the December meeting of the Federal Open Market Committee, the central bank projections showed at least four rate increases for 2016.
Gold weakens
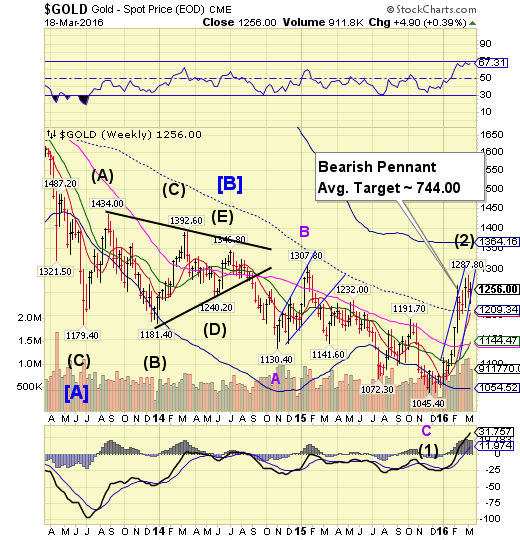
Gold weakened, as indicated last week. The period of strength has run out, suggesting new lows may soon arrive. A reversal may be indicated by declining beneath this week’s low at 1226.00. Once complete, Ending Diagonals are completely retraced, leaving this move as a potential false breakout within the downtrend.The media is still bullish.
(CNBC) The performance of gold during 2016 has caught many investors by surprise, outperforming all major asset classes.
Given the strong performance of gold and gold equities so far in 2016, it is instructive to examine factors contributing to this strength and assess their likelihood to continue in the future. With respect to the performance of gold bullion, during the past two-and-a-half years, staunch global physical demand has been carving out a durable price floor for gold in the general vicinity of $1,100 to $1,200 per ounce.
Crude challenged at the Bearish Flag.
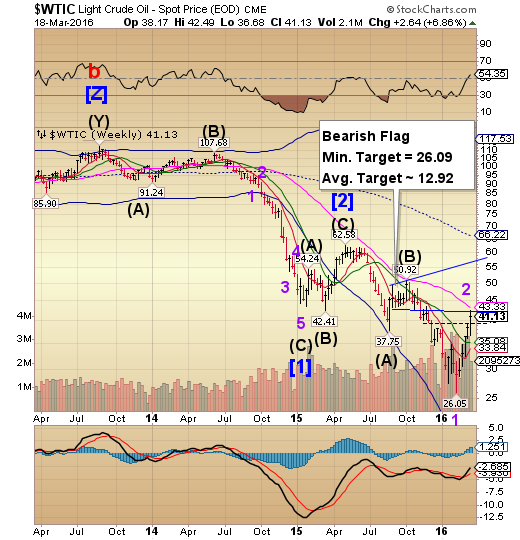
Crude rallied above a short-term resistance area at 38.50, but was repelled by the trendline of the Bearish Flag. The Cycles Model period of strength lasted another week, with the high being made on Friday. Crude may resume the decline through late March, with Cycle Bottom Support continuing to fall away at 14.91, lending support to the average target analysis of the Bearish Flag. Analysts won’t be calling for a bottom when it finally arrives.
(Barrons) Crude oil prices are down, erasing today’s earlier gains that had the commodity hitting a new 2016 high after data showed a rise in rig counts and investors locked in profit. Still, the U.S. benchmark remains on track to end the week in the green.
U.S. crude contracts for April delivery fell 42 cents, or 1.04% to a recent $39.78 a barrel. Earlier today, the price rose to $41.20 a barrel, marking a new 2016 high.
Brent futures fell 24 cents to $41.30.The U.S. oil benchmark broke above $40 a barrel Thursday for the first time this year, extending a rally that has seen prices rebound 53% from a near 13-year low reached last month. Prices have been bolstered by hopes that producers will cut production and a two-year global supply glut will abate.
Shanghai Index challenges mid-Cycle resistance.
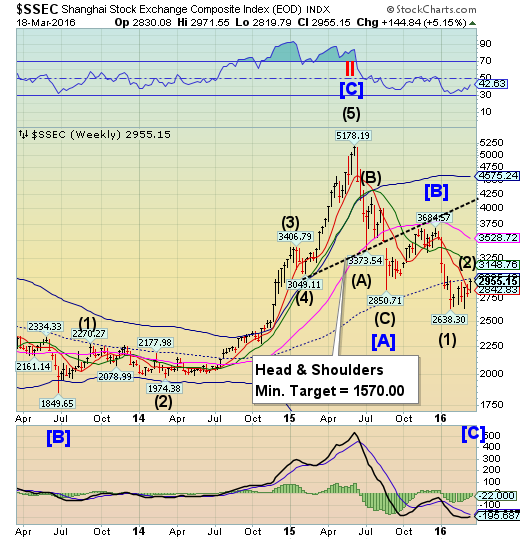
The Shanghai Index broke above its sideways consolidation to challenge mid-Cycle resistance at 2985.16. The Cycles Model calls for an early-to-mid-week pivot that reverses into a possible panic decline through the end of the month.
(ZeroHedge) In early February we observed a new, troubling trend among Chinese corporations: soaring corporate debt as a result of a surge in cross-border M&A.
As we said then "Chinese corporate leverage, represented by the traditional debt/EBITDA ratio is, in some cases, absolutely ludicrous, especially among companies which in recent weeks have tried to mask their balance sheet devastation through global M&A activity, such as ChemChina's recent record for a Chinese company $44 billion purchase of Syngenta (NYSE:SYT), or Zoomlion (OTC:ZLIOY)'s $3.3 bid for US rival Terex (NYSE:TEX) last month."
The Banking Index makes a nominal new high.
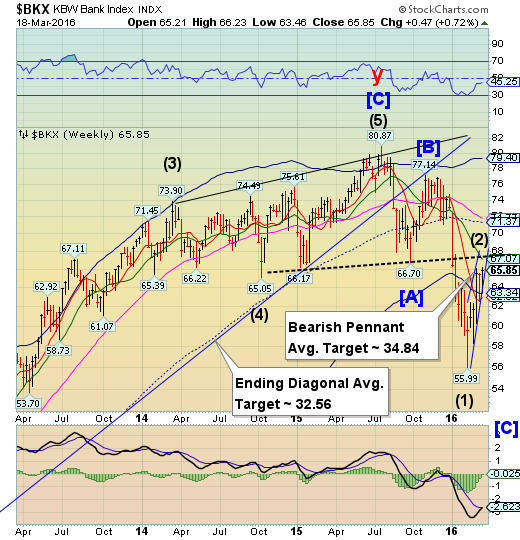
BKX made a nominal new two-week high, but was not capable of meeting the old Head and Shoulders neckline. The Cycles Model now suggests a probable decline to the end of March that may exceed this year’s initial decline..
(WSJ) One of Donald Trump’s closest allies on Wall Street is a now-struggling German bank.
While many big banks have shunned him, Deutsche Bank AG (DE:DBKGn) has been a steadfast financial backer of the Republican presidential candidate’s business interests. Since 1998, the bank has led or participated in loans of at least $2.5 billion to companies affiliated with Mr. Trump, according to a Wall Street Journal analysis of public records and people familiar with the matter.
That doesn’t include at least another $1 billion in loan commitments that Deutsche Bank made to Trump-affiliated entities.
(Bloomberg) European Central Bank Governing Council member Jens Weidmann warned against starting a discussion about handing out cash to stimulate growth, FunkeMediengruppe reported, citing an interview.
“Helicopter money isn’t manna falling from heaven, but would rip huge holes in central bank balance sheets,” Weidmann, who heads Germany’s Bundesbank, said, according to the newspaper. “The euro area states and taxpayers would pay the bill in the end.”
(Fortune) Federal Reserve supervisors can reduce but not eliminate the risk of bank failures, New York Fed President William Dudley said on Friday in a defense of his agency’s Wall Street oversight as a congressional review of it ramps up.
Supervisors, who sometimes work day-to-day inside banks, “can reduce the chances” that these firms fail “but can never guarantee” that, said Dudley, whose branch of the U.S. central bank serves as its eyes and ears on Wall Street.
The New York Fed has been the target of criticism since the financial crisis for missteps and perceived conflicts of interest. Reuters reported this month that Democratic House lawmakers Maxine Waters and Al Green asked a congressional watchdog to investigate lax bank oversight there.
(ZeroHedge) Back in January, Deutsche Bank reported what were variously described as “horrible,” “grim” results.
The net loss for 2015 came in at roughly $7 billion, the first annual loss since the crisis. The abysmal year was capped off by €2.1 billion of red ink in Q4 of which some €1.2 billion was attributable to litigation.
The Q4 breakdown - which came a few days after CEO John Cryan initially reported how bad 2015 truly was - was a nightmare. Revenues plunged 30% in corporate banking and securities where provisions for credit losses jumped from just $9 million in Q4 2014 to $115 million. Citi questioned whether the bank’s investment bank model is in “structural decline.”
