Get 40% Off
🚨 Volatile Markets? Find Hidden Gems for Serious Outperformance
Find Stocks Now

5 Charts Show Why I Remain Bullish Gold

Published 11/03/2016, 06:06 AM
Updated 07/09/2023, 06:31 AM

In this post, I'd like to look at some gold charts, since the yellow metal has been showing some relative strength since October. We can even go back to February of this year which shows a possible big diamond consolidation pattern building out. Regardless of whatever trading discipline one uses, the last nine months of price action has been difficult at best to read.
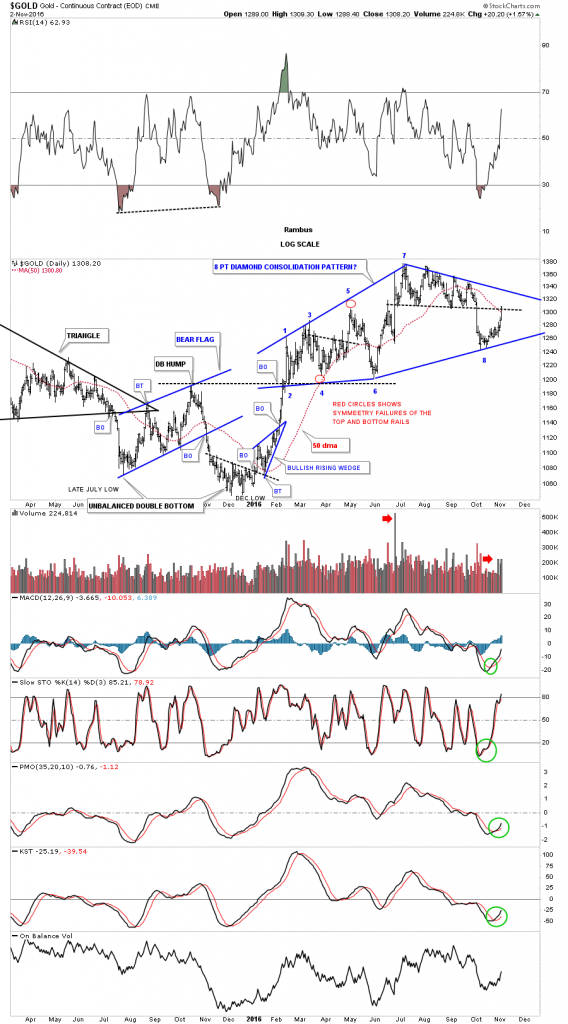
Gold Daily

This next chart is a linear scale chart for gold which I think may be the most important chart to help give us a sense of the bear market that began in September of 2011. What makes this chart so interesting is the breakout and backtest to the top rail of the bear market expanding falling wedge.
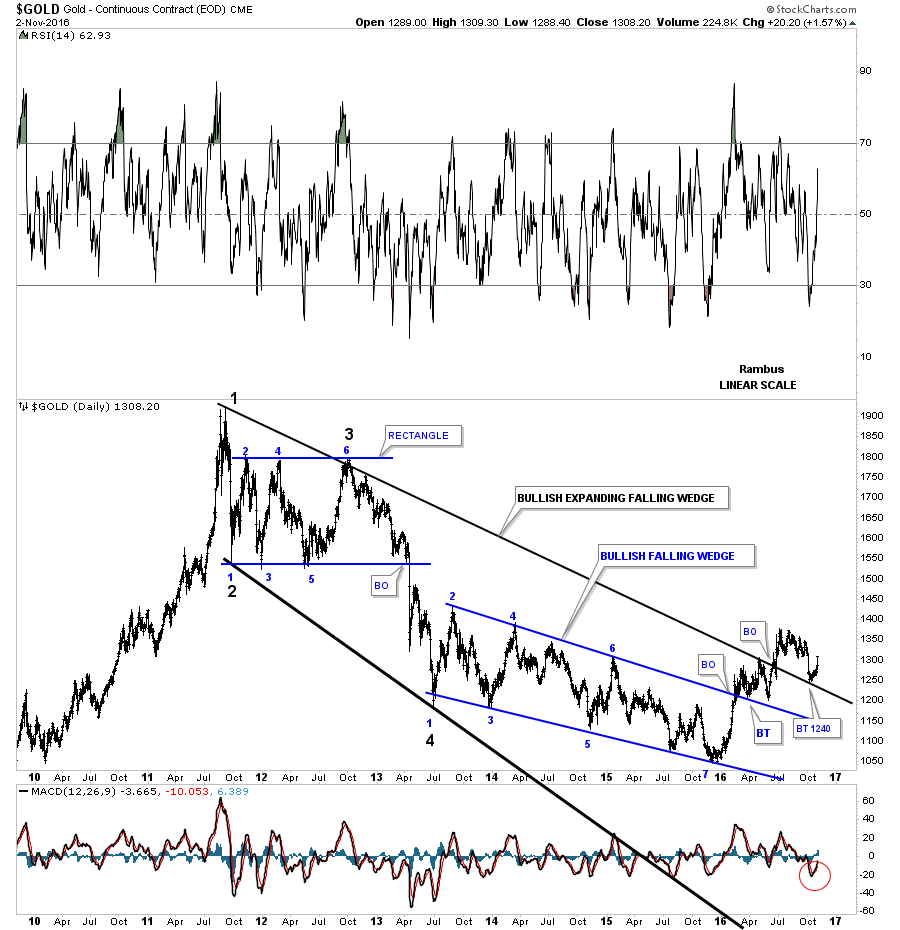
Gold Daily 2010-2016

This next chart for gold is the important moving average crossover chart which shows the four most important daily moving averages for gold. The green circle back in 2009 shows when they all became positively aligned and led to the parabolic run to 1920. Then in 2013 they all became negatively aligned to the downside which led to the bear market as shown by the red circle.

It took three more years of bear market price action to finally get the four important moving averages bullish aligned again which occurred in April of this year.
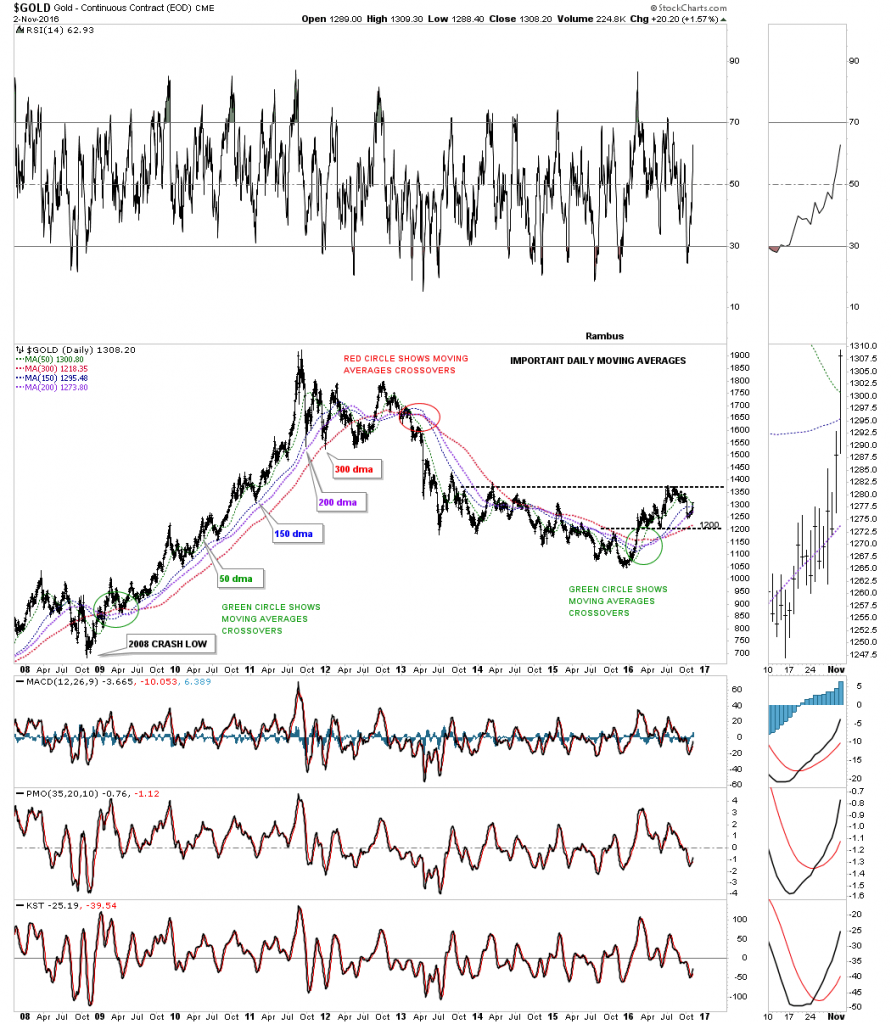
Gold Daily 2008-2016

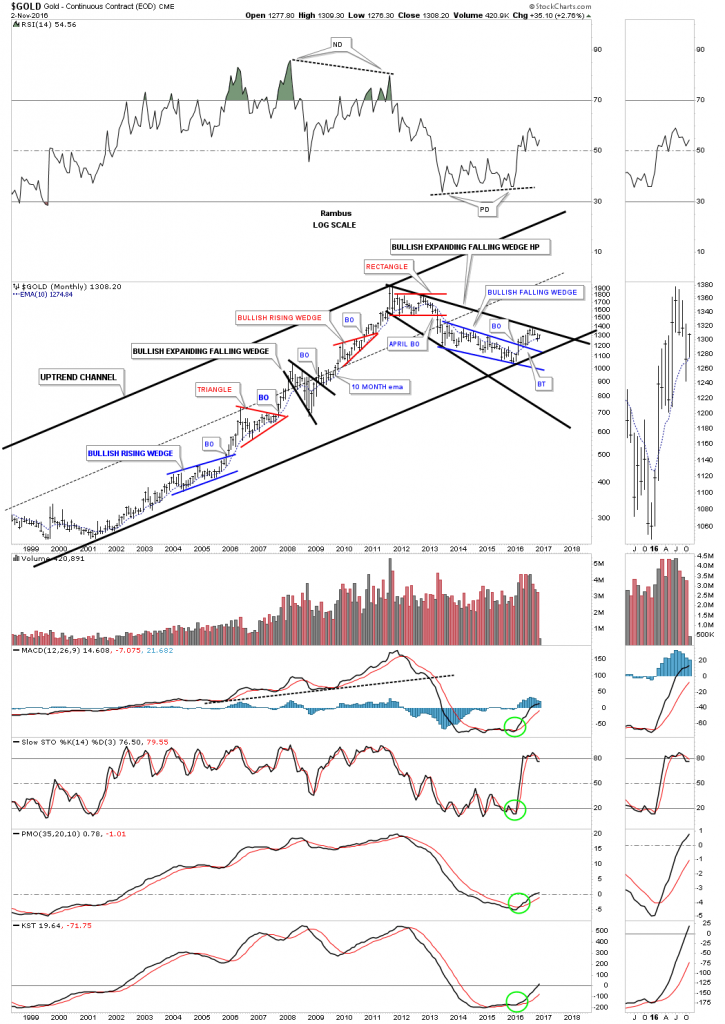
This next chart for gold is an eighteen-year log scale chart which shows the bull market uptrend channel that began to form back in 2000 or so. This log scale chart gives us a slightly different view of the bear market expanding falling wedge which shows the price action still trading below that important trendline. The 10 month ema has done a good job of holding both support and resistance during this now almost 17-year bull market.
3rd party Ad. Not an offer or recommendation by Investing.com. See disclosure here or remove ads .

Gold Monthly 1998-2016

This last chart for gold is a 40-year look which shows a massive 27 year H&S consolidation pattern and the bull market uptrend channel that began in 2000. The bottom line is that as long as the bottom rail of the 2000 uptrend channel remains intact I will remain a bull.
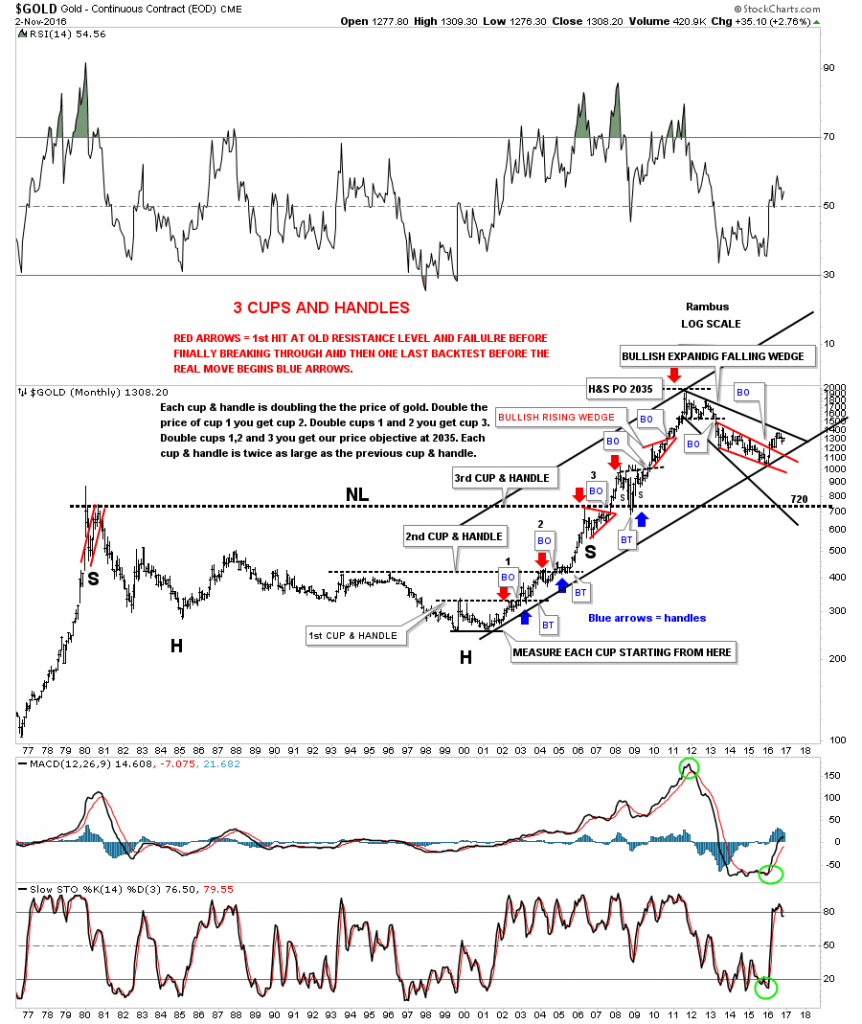
Gold 3 Cups And Handles

Latest comments

Risk Disclosure: Trading in financial instruments and/or cryptocurrencies involves high risks including the risk of losing some, or all, of your investment amount, and may not be suitable for all investors. Prices of cryptocurrencies are extremely volatile and may be affected by external factors such as financial, regulatory or political events. Trading on margin increases the financial risks.
Before deciding to trade in financial instrument or cryptocurrencies you should be fully informed of the risks and costs associated with trading the financial markets, carefully consider your investment objectives, level of experience, and risk appetite, and seek professional advice where needed.
Fusion Media would like to remind you that the data contained in this website is not necessarily real-time nor accurate. The data and prices on the website are not necessarily provided by any market or exchange, but may be provided by market makers, and so prices may not be accurate and may differ from the actual price at any given market, meaning prices are indicative and not appropriate for trading purposes. Fusion Media and any provider of the data contained in this website will not accept liability for any loss or damage as a result of your trading, or your reliance on the information contained within this website.
It is prohibited to use, store, reproduce, display, modify, transmit or distribute the data contained in this website without the explicit prior written permission of Fusion Media and/or the data provider. All intellectual property rights are reserved by the providers and/or the exchange providing the data contained in this website.
Fusion Media may be compensated by the advertisers that appear on the website, based on your interaction with the advertisements or advertisers.
© 2007-2024 - Fusion Media Limited. All Rights Reserved.