
After taking a few days to consolidate gains following the Bernanke-Draghi two-week two step, the market “liquidified” again… as in, rained dollars down on investors. On Thursday, “Helicopter” Ben and the Federal Reserve continued their promise to boost asset prices, including housing, but added a new wrinkle… a goal of lowering unemployment. Enter QE3. And more political and economic debate just in time for Presidential election season.
Apparently more bond buying (of the mortgage backed variety) is going to assist in getting cash heavy companies to accelerate hiring again. In many ways, it’s unfortunate that America is left to rely so heavily on the Fed, but due to political gridlock (and our distaste for natural cycles) there really aren’t a lot of options. So fiscal cliff or not, Big Ben stands ready to stretch the balance sheet.
Price Action
Now back to what matters most to active investors -- price action. And that has been going higher. In summary, last week saw continuations for Small Caps (IWM), Emerging Markets (EEM), the Financial Sector (XLF), Commodities (CRB),Homebuilders (XLB), Technology (QQQ) and, well yeah, you get the picture; the market went up. But a brief excerpt from last week reminds us to stay focused and disciplined, especially if involved in high beta stocks:
“Well although higher seems likely over the coming weeks, the stock market doesn’t tend to move in a straight line. And further, the market never takes it easy on us. So if it starts to feel “easy,” check yourself by drawing on past experience; in short, active investors need to stay focused on technical indicators and important support and resistance levels. The second we get complacent, we open the door for a costly mistake.”
What's Ahead?
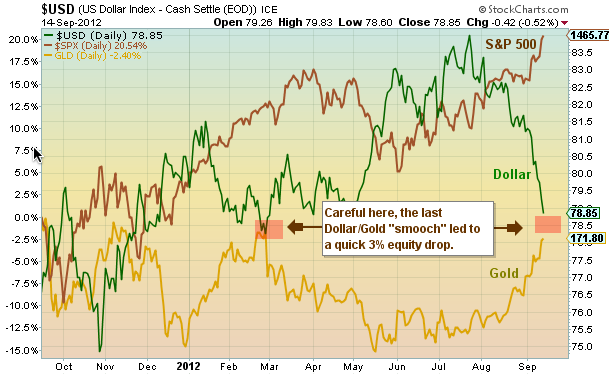
So what are the charts telling us? Well, the S&P 500 almost reached that pesky 1478 open gap magnet I mentioned last week, and still has the 1497 gap on its radar. I’d think that anything above last week’s high will trigger some profit taking, considering overbought conditions and the way the market reversed off 1474. Support resides below near the breakout band at 1435-1440, then 1400. Today will mark bar 8 of 9 of a daily sell setup on many indices, including the S&P 500, which could limit upside. Also, the Dollar recorded a daily buy setup last Thursday, so it is expected to firm up a bit this week. As well, the second chart down (a continuation of last week’s Gold and S&P 500 versus the U.S. Dollar analysis). A Dollar-Gold “kiss” could bring some near term selling.
Looking a bit further out, the AAII percentage of Bulls stands at just 36.5 as of last week (39 is long term average) and although it should rise considerably next week, it is still within the bounds of reason. As well, the percentage of S&P 500 stocks above the 150 day average is below 80 and under Spring highs. This will likely keep short index funds on a tight trading leash (Note I took a starter in the Short S&P 500 index fund (SH) on Friday).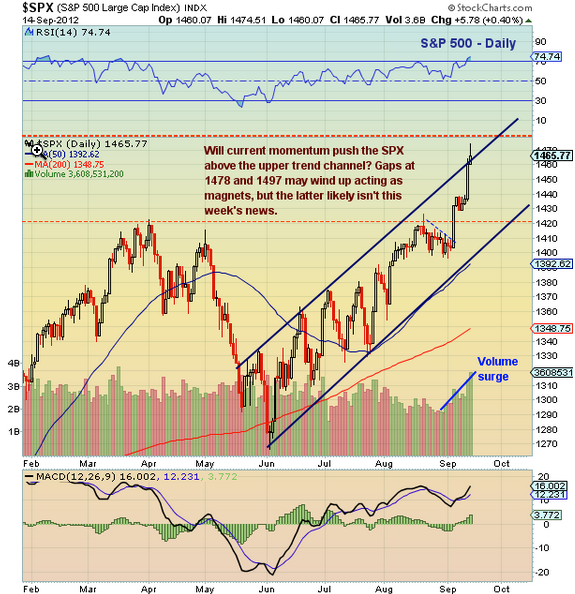
- English (UK)
- English (India)
- English (Canada)
- English (Australia)
- English (South Africa)
- English (Philippines)
- English (Nigeria)
- Deutsch
- Español (España)
- Español (México)
- Français
- Italiano
- Nederlands
- Português (Portugal)
- Polski
- Português (Brasil)
- Русский
- Türkçe
- العربية
- Ελληνικά
- Svenska
- Suomi
- עברית
- 日本語
- 한국어
- 简体中文
- 繁體中文
- Bahasa Indonesia
- Bahasa Melayu
- ไทย
- Tiếng Việt
- हिंदी
Watch Indicators, Support/Resistance Levels
Published 09/17/2012, 10:43 AM
Updated 07/09/2023, 06:31 AM
Watch Indicators, Support/Resistance Levels
3rd party Ad. Not an offer or recommendation by Investing.com. See disclosure here or
remove ads
.
Latest comments
Install Our App
Risk Disclosure: Trading in financial instruments and/or cryptocurrencies involves high risks including the risk of losing some, or all, of your investment amount, and may not be suitable for all investors. Prices of cryptocurrencies are extremely volatile and may be affected by external factors such as financial, regulatory or political events. Trading on margin increases the financial risks.
Before deciding to trade in financial instrument or cryptocurrencies you should be fully informed of the risks and costs associated with trading the financial markets, carefully consider your investment objectives, level of experience, and risk appetite, and seek professional advice where needed.
Fusion Media would like to remind you that the data contained in this website is not necessarily real-time nor accurate. The data and prices on the website are not necessarily provided by any market or exchange, but may be provided by market makers, and so prices may not be accurate and may differ from the actual price at any given market, meaning prices are indicative and not appropriate for trading purposes. Fusion Media and any provider of the data contained in this website will not accept liability for any loss or damage as a result of your trading, or your reliance on the information contained within this website.
It is prohibited to use, store, reproduce, display, modify, transmit or distribute the data contained in this website without the explicit prior written permission of Fusion Media and/or the data provider. All intellectual property rights are reserved by the providers and/or the exchange providing the data contained in this website.
Fusion Media may be compensated by the advertisers that appear on the website, based on your interaction with the advertisements or advertisers.
© 2007-2024 - Fusion Media Limited. All Rights Reserved.