Forex News and Events
Sell USD rally
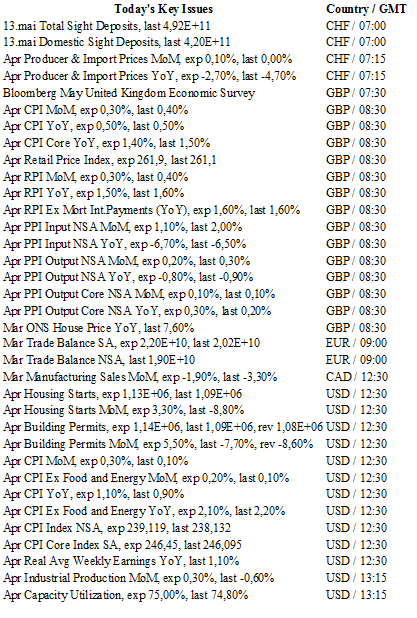
The recent rally in US front-end yields has supported USD buying. However, the lack of fundamental developments indicates that this rally will be short-lived. US Dollar Index rallied 3% to 94.84 in May, as U.S. 2-Year yields rose in a similar pattern, rising to 0.79%. Judging from pared back USD shorts in IMM data the move feels more like winding down USD shorts on limited expected downside rather than different expectations. Today should bring another round of disappointing economic data entrenching Yellen’s cautiously dovish stance. Markets are expecting today’s headline CPI read to indicate further improvement yet the core CPI read is likely to decelerate to 2.1% from 2.2% suggesting that early recovery is likely to further fade alongside weak economic activity.
US industrial production is expected to recover from the disappointing March read of -0.6% to 0.3% (the only increase in seven months) with significant risk to the downside. Incoming data, including external data, indicates a softer read. Despite a weak USD supporting the manufacturing sector dominant soft international conditions make it difficult to see a sustainable acceleration in the US (rather an uneven economy, bumping along). For both inflation data and industrial production there is a solid risk of a below consensus read and USD sell-off. The Wednesday FOMC meeting release should highlight worries over slowing activity data, halting the random hawks tightening message. With no fundamental reasons to expect tightening near term, we remain bearish on the USD. EUR/USD is now staging a reversal of 50d MA at 1.1310 with a near term target located at 1.1466 range resistance.
RBA reluctantly cuts rates
The release of minutes from the latest RBA meeting saw a strengthening in the Aussie against the dollar to 0.7350 after the minutes revealed the less dovish stance of RBA members. The very soft inflation seems to have forced policymakers to cut their benchmark interest rate to 1.75% from 2%. Inflation is clearly suffering and the country is facing its first deflation period since 2008 with Q1 inflation printing at -0.2% q/q. There are now growing pressures that the Australian Central Bank needs to lower its inflation target, currently between 2% and 3%, in order to reflect the increasing global deflation pressures that are out of its control.
We believe that members are waiting to collect more data - global and domestic - to adjust their monetary policy. In our view this is why no rate cut should happen at the June meeting. However, it seems it will also prove difficult for members to further cut rates at the August meeting but future markets have already priced in another rate cut to 1.5% at around 50%. In addition, Aussie strength should not last long as there is no reason why Australia will not participate in the global currency war judging by the fact that the first symptom of necessary devaluation is already evident: low inflation.

The Risk Today
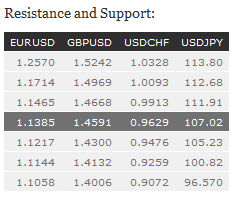
EUR/USD is riding slightly higher. Hourly support is given at 1.1272 (27/04/2016 high) while stronger support can be found at 1.1217 (24/04/2016 low). Hourly resistance is located at 1.1479 (06/05/2016 high) and stronger resistance lies at 1.1616 (12/04/2016 high). Expected to show further weakness. In the longer term, the technical structure favours a bearish bias as long as resistance at 1.1746 ( holds. Key resistance is located at 1.1640 (11/11/2005 low). The current technical appreciation implies a gradual increase.
GBP/USD has bounced back higher. Hourly support is given at 1.4300 (21/04/2016 low) while hourly resistance can be found at 1.4543 (06/05/2016 high). Stronger resistance is located at 1.4770 (03//2016 high). Expected to break resistance at 1.4543. The long-term technical pattern is negative and favours a further decline towards key support at 1.3503 (23/01/2009 low), as long as prices remain below the resistance at 1.5340/64 (04/11/2015 low see also the 200 day moving average). However, the general oversold conditions and the recent pick-up in buying interest pave the way for a rebound.
USD/JPY is pausing below 110. Hourly resistance can be found at 109.57 (13/05/2016 high) and stronger resistance is given at 111.91 (24/04/2016 high). Hourly support lies at 106.25 (04/05/2016 low). Expected to show further buying pressures as the pair lies within an uptrend channel. We favour a long-term bearish bias. Support at 105.23 (15/10/2014 low) is on target. A gradual rise towards the major resistance at 135.15 (01/02/2002 high) seems now less likely. Another key support can be found at 105.23 (15/10/2014 low).
USD/CHF is pushing higher despite ongoing momentum does not seem strong. Hourly resistance can be found at 0.9797 (22/04/2016 high) while a break of hourly support is located at 0.9652 (06/05/2016 low) would confirm deeper selling pressures. Expect to break resistance at 0.9797. In the long-term, the pair is setting highs since mid-2015. Key support can be found 0.8986 (30/01/2015 low). The technical structure favours a long term bullish bias.

