
Vornado Realty Trust (NYSE:VNO) reported second-quarter 2019 funds from operations (FFO) plus assumed conversions, as adjusted of 91 cents per share, missing the Zacks Consensus Estimate of 94 cents. Also, the reported figure compares unfavorably with the year-ago tally of 98 cents.
The decline in FFO as adjusted was attributed to 4 cents per share of non-cash write-off of straight-line rent receivables and 3 cents of non-cash expense for the time-based equity compensation granted in relation to the previously-announced new leadership group.
The company exited the quarter with lower year-over-year occupancy across all its portfolios. Further, a decline in the New York portfolio’s same-store net operating income (NOI) affected results.
Total revenues came in at $463.1 million in the reported quarter, missing the Zacks Consensus Estimate of $542.5 million. Further, the revenue figure compares unfavorably with the year-ago tally of $541.8 million.
Behind the Headline Numbers
In the New York portfolio, 221,000 square feet of office space (155,000 square feet of space at share) and 70,000 square feet of retail space (67,000 square feet of space at share) were leased during the June-end quarter. Also, 30,000 square feet of area was leased in theMart and 30,000 square feet was leased at 555 California Street (21,000 square feet at share).
At the end of the second quarter, occupancy in the New York portfolio was 96.5%, shrinking 50 basis points (bps) sequentially, and 10 bps year over year. Occupancy in theMART was 94.8%, down 10 bps sequentially and 450 bps year over year. Furthermore, occupancy in 555 California Street was 99.5%, improving 10 bps sequentially but contracting 220 bps year over year.
During the second quarter, total same-store net operating income (NOI) inched up 1.2% year over year. In fact, same-store NOI at the company’s share edged down 0.7% year over year for the New York portfolio. The same for theMART and 555 California Street grew 12.1% and 13%, year over year, respectively.
As of Jun 30, 2019, Vornado had nearly $922.6 million of cash and cash equivalents, up from $570.9 million as of the prior-year end.
Our Viewpoint
In second-quarter 2019, Vornado made strategic attempts to strengthen its core business by executing opportunistic divestures that provided the company with the dry powder to reinvest in opportunistic acquisitions and redevelopments. In fact, during the April-June quarter, Vornado closed sale of 11 condominium units at 220 CPS for net proceeds amounting to $265.25 million. This resulted in a financial statement net gain of $111.7 million.
However, the disappointing job market in New York was a drag for the company’s office portfolio.
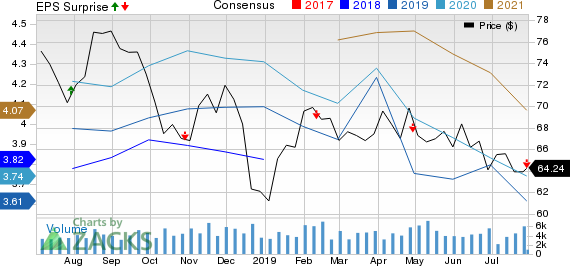
Vornado Realty Trust Price, Consensus and EPS Surprise
Currently, Vornado carries a Zacks Rank #3 (Hold). You can see the complete list of today’s Zacks #1 Rank (Strong Buy) stocks here.
Performance of Other REITs
Cousins Properties Incorporated (NYSE:CUZ) reported second-quarter FFO per share (before TIER transaction costs) of 71 cents, missing the Zacks Consensus Estimate by a whisker. Nonetheless, the figure came in higher than the prior-year quarter’s reported tally of 60 cents.
SL Green Realty Corp. (NYSE:SLG) delivered second-quarter 2019 FFO of $1.82 per share, surpassing the Zacks Consensus Estimate of $1.73. The tally includes promote income from the sale of 521 Fifth Avenue of $3.4 million or 4 cents per share. Results also compared favorably with the year-ago quarter’s tally of $1.69.
Crown Castle International Corp. (NYSE:CCI) posted second-quarter adjusted AFFO per share of $1.48, up from the prior-year figure of $1.31. Further, the reported figure outpaced the Zacks Consensus Estimate of $1.43.
Note: Anything related to earnings presented in this write-up represent funds from operations (FFO) — a widely used metric to gauge the performance of REITs.
Today's Best Stocks from Zacks
Would you like to see the updated picks from our best market-beating strategies? From 2017 through 2018, while the S&P 500 gained +15.8%, five of our screens returned +38.0%, +61.3%, +61.6%, +68.1%, and +98.3%.
This outperformance has not just been a recent phenomenon. From 2000 – 2018, while the S&P averaged +4.8% per year, our top strategies averaged up to +56.2% per year.
See their latest picks free >>
Crown Castle International Corporation (CCI): Free Stock Analysis Report
SL Green Realty Corporation (SLG): Free Stock Analysis Report
Vornado Realty Trust (VNO): Free Stock Analysis Report
Cousins Properties Incorporated (CUZ): Free Stock Analysis Report
Original post