Following my post of the 7th October when I made it clear that the e-mini indices and equity markets in general were in a fragile state, this week’s price action has more than validated this analysis, as the correction in the longer term bullish trend finally arrived.
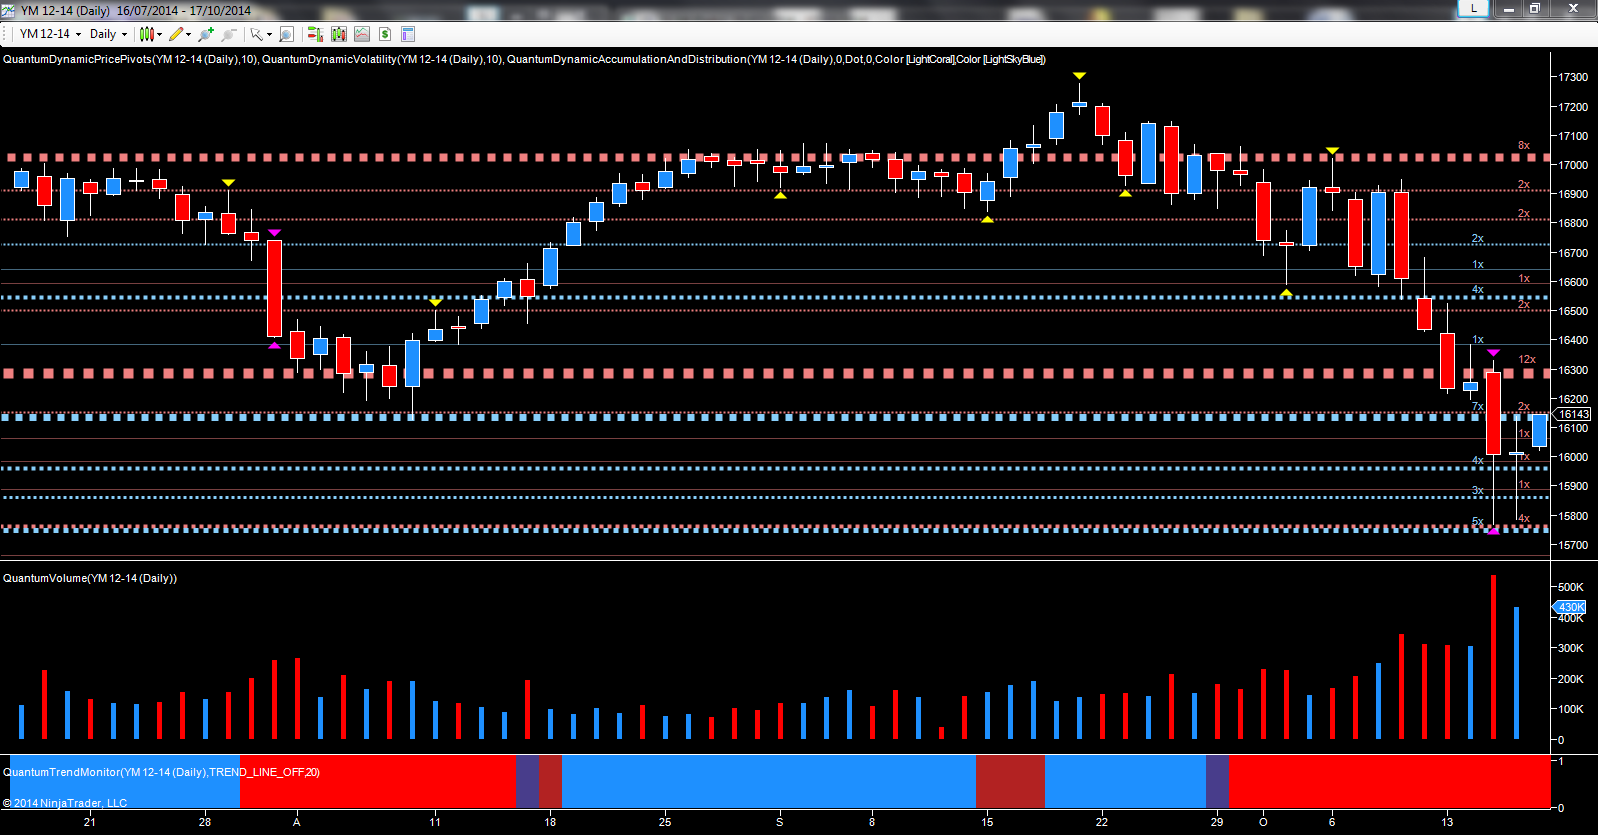
The last two days have been dramatic to say the least, with equity markets plunging and then recovering on an intraday basis, as volatile price action engulfed the financial world, with the VIX spiking higher, and indices plunging lower. However, for volume traders, all is calm, and it is during periods such as this, that volume price analysis provides the complete picture of where the market is heading next, and on the daily chart for the e-mini YM, we have the clearest example yet that a bottom is being formed in the 15,750 area.
Wednesday’s price action was electrifying with the index tumbling over 550 points from the overnight session and into the physical open, before recovering later in the day to close marginally above the 16,000 level at 16,007. Yesterday’s price action followed a similar pattern, with the index falling sharply, only to recover later once more, and closing at 16,005. On both occasions the low of each day tested the platform of support in the 15,750 region before bouncing back. Whilst the price action is descriptive enough, with both candles closing with deep lower wicks, and signalling sustained buying at these levels, it is volume which as always validates the price action, and even for those traders who are ‘non believers’, the picture could not be clearer.
Massive volume spikes supporting a market which has reversed can only mean one thing and one thing only. The big operators and market makers are buying the market and we can now expect to see a reversal and rally higher in due course. The first level of resistance which needs to be breached is in the 16,150 region, and if this is cleared then expect to see the index climb higher to test a deeper level in the 16,300 region. A move through here is then likely to see a return to the 17,000 level once again in the longer term as the recent storm subsides and the sun begins to shine once more. The question that everyone is asking, is this – have we seen the ‘big short’ or simply a long overdue correction? In my book, it’s the latter and for one simple reason. There was no major selling climax of volume prior to the correction itself.
