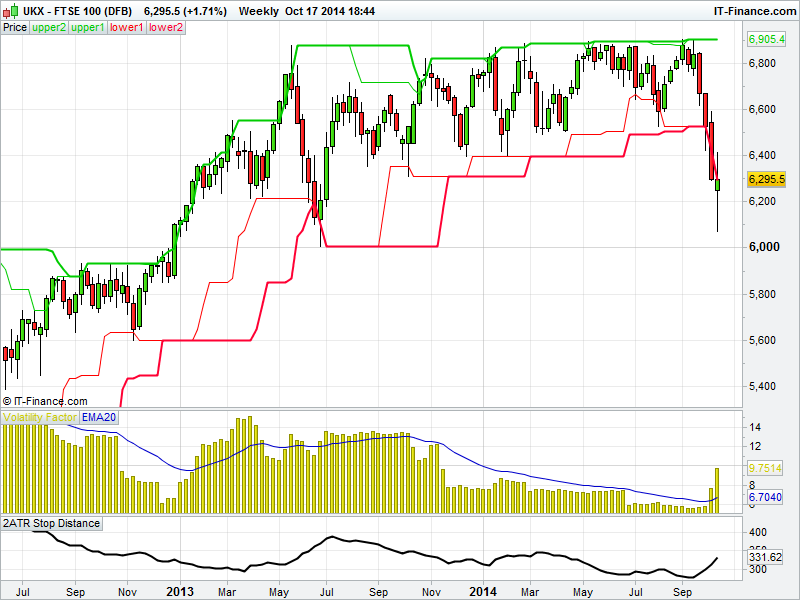
Given the wild gyrations in the market over the last few days, one thing which has been reinforced to me is the the benefit in basing your position size on some form of volatility measurement.
As volatility expands, then your position size should be reduced when initiating a new position. To keep your risk per trade consistent, this would be combined with your initial stop position being further away from your entry. This is to allow for the increased levels of volatility.
One things traders tend to do (particularly if they have a small amount of equity) is base their position size on either a minimum size requirement, or some ideal size they want to have. This can lead to all sort of problems with risk control. It would only take one trade to unexpectedly gap through your stop level, with too large a position size, for a significant loss to be incurred, or in extreme cases your account to be blown up.
Good traders know this, and adjust their position size according to the volatility of the instrument they are trading. Richard Dennis and the Turtle traders were amongst those who used such a method, using a multiple of average true range.
Adjusting your position size in this manner will also help you emotionally when managing a position.
If however you are already in a position and volatility increases, then this can be a good thing. One thing I try and look for when evaluating a potential set up is for a contraction in volatility over a period of time. Quite often, an entry signal is generated when the volatility is at its lowest for several weeks or even months. What I then look for is an expansion in volatility in the direction of the trend I am looking to trade.
A good example of this is shown here on the weekly chart of the FTSE. Here you can clearly see how volatility has dried up (as indicated on the Volatility Factor indicator) over the preceding months prior to a short signal being given a couple of weeks ago. A similar sort of contraction and then expansion is shown on the long signal given at the end of 2012.

On the other hand, day traders and short-term traders crave volatility - the swings in the indices for example this week would have been the source of great opportunities to make decent profits in a matter of minutes. However, if their position sizing and initial stop placement did not also reflect the increase in volatility then it would have been all too easy to be knocked out for a full 1R loss (or more) in seconds!
If your account is too small to factor in the requisite increase in volatility, or there is a minimum position size that, when combined with an increase in volatility means they would be risking too much, you should simply pass on the trade. As always, capital preservation and prudent risk control will help you stay in the game when things get wild.
