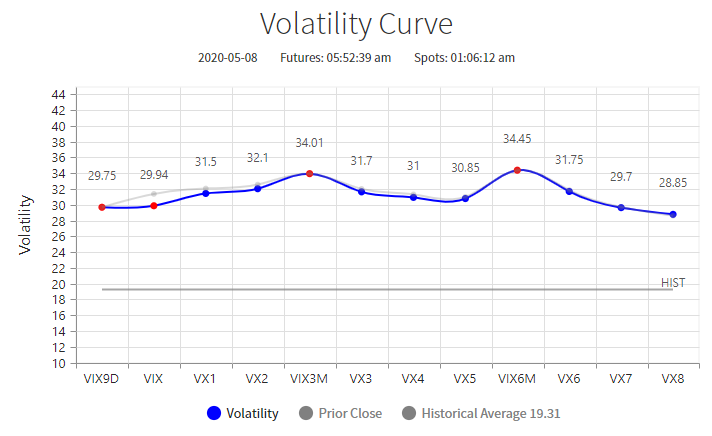
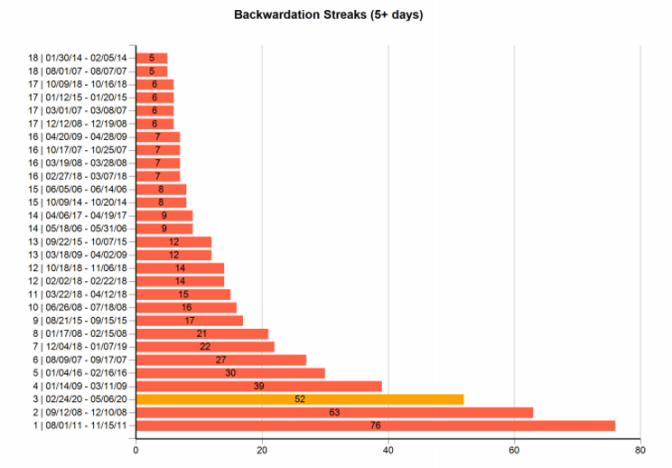
The VIX Futures curve has been in Backwardation for 53 trading days since February 24th, which is the 3rd longest such streak since the VIX futures market was started in 2004. Only during the Financial Crisis of 2008 and AAA-downgrade of US treasury debt in 2011 have we seen longer such streaks. Backwardation is a state of the VIX futures curve where the front month VIX futures contract trades above the 2nd month VIX future contract and generally represents a situation where market participants are more concerned with present market risks rather than future market risks and thus are willing to pay premiums prices for nearer term insurance to protect their portfolios. Historically, the VIX futures curve is in backwardation only about 17% of the time and that coincides with periods when the stock market is in significant distress. Long backwardation streaks are rare and vast majority of the time backwardation streaks end before they reach their tenth day.
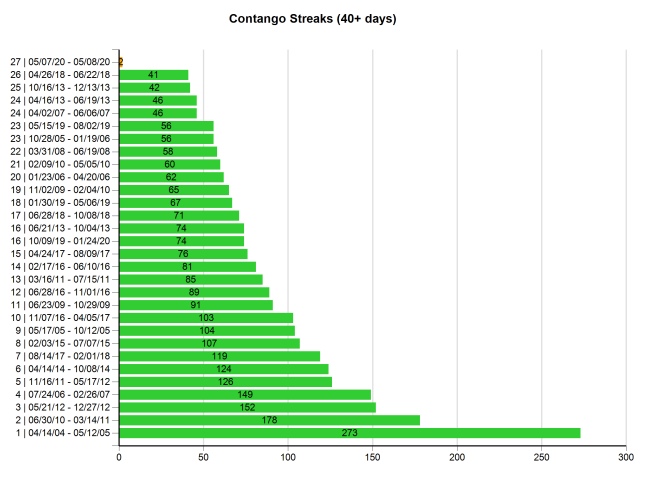
The more interesting news last week was that the VIX futures curve entered Contango (the opposite of Backwardation) on Thursday and that is potentially a very strong bullish signal for the stock market. The VIX futures curve tends to spend long periods in Contango, in some cases years and that tends to coincide with major bull runs in the stock market. When the VIX futures curve is in Contango, major market participants think that the market is less risky today than in the future – which is the normal state of affairs since the future is more uncertain. They are less willing to pay for near term portfolio insurance and that in itself is a signal of confidence that at the very least market prices are not going to decline in a major way from here. Investors and traders then are more willing to take on risk, bet on higher prices in the future and hope to get lucky. When the VIX futures curve enters Contango that is a major signal for many risk parity, asset management and momentum algos and they switch from selling the rips in the stock market to buying the dips.
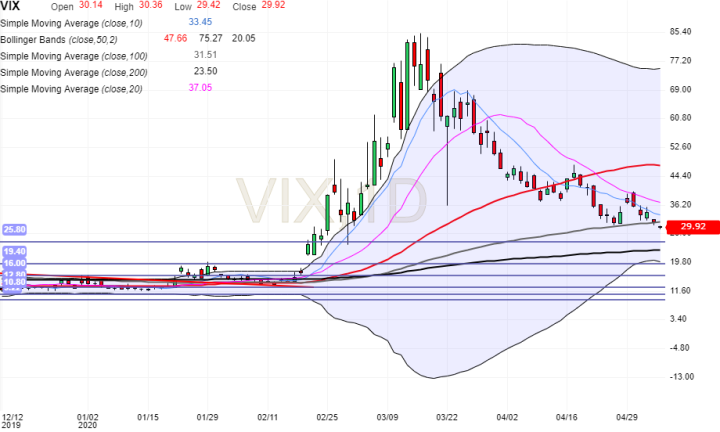
We have seen big improvement in the volatility complex over the past 2 weeks. Both realized and implied volatility has declined as the market has rallied. Not only have volatility term spreads on the front end of the Volatility Curve flattened from very steep inversions into Contango, but we have also seen volatility momentum measures ease with the VIX trading below its 10MA and 50MA averages for a month now and volatility of volatility measures like VVIX decline from historically high levels of 180 down to more normal levels like 120, even though 120 is still historically high. There are reasons to believe that volatility measures can come in further in the coming weeks.
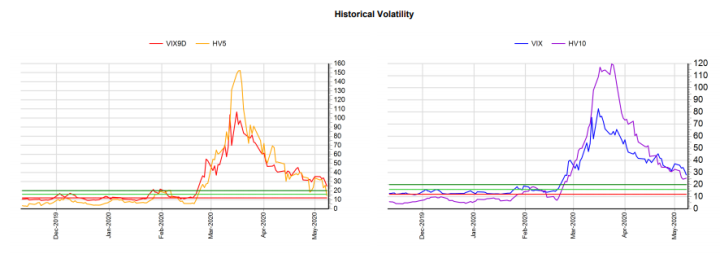
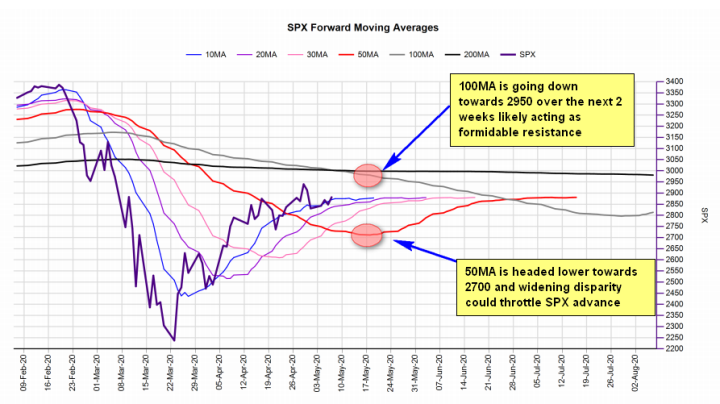
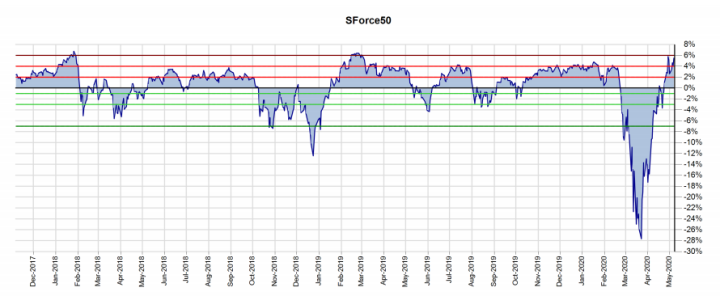
On the chart above, a forward-moving average is calculated by assuming that forward SPX prices are the same as the latest SPX price. The longer the moving average is, the more predictive the path of the forward average is since an individual day carries less overall weight. Usually, this chart tends to show where the 200MA, 100MA and 50MA are going to end up fairly accurately over the next 2-4 weeks. What we see here is that the SPX will enter major resistance around the 2950-3000 area because that is where the 100MA and 200MA are crossing over while simultaneously the 50MA will continue to decline all the way down to 2700 in coming weeks. The SPX tends to oscillate around its 50MA pretty reliably so the more the SPX disconnects with it, the more likely it is to mean revert back to it and the SPX is already 7% above its 50MA which is a reading that is not sustained for long periods of time as you can see on the SForce50 chart above. This means that baring some major fundamental developments the market will likely be trapped in a trading range between 2700 and 2950 over the next month as it tries to mean revert back to its 50MA while simultaneously trapped by its 100MA. That means that near term SPX realized volatility which has already declined from very high levels may continue to decline in the coming weeks. That, in turn, means that implied volatility (VIX, VIX9D) may continue to decline since realized and implied volatility trends are closely related. When volatility declines, the markets are bid more. We may have entered a positive feedback loop between volatility markets and regular markets which tends to fuel market upside.
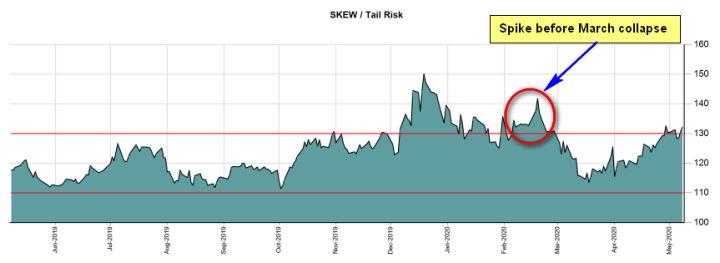
However, we should not forget that market fundamentals – earnings and the economy – are very bad and it won’t take much to disturb this bullish picture that volatility markets are trying to paint. Volatility may be coming in simply because of exhaustion. The high volatility readings in March are not sustainable in the long term. One warning to heed here is the rise of the SKEW which measures bets on potential big market drops of over 5% (tail risk). The SKEW has been steadily rising over the past two weeks and is now over the critical 130 area which means some market participants are making a bet that some unforeseen event might shake us out suddenly of this upward grind the market has seen over the past month. Notice that high SKEW readings above 130 in February preceded the historic March collapse. As volatility continues to come in and the SPX reaches higher valuations and becomes more detached from fundamentals, the risk of a big down day in the market of the -5% variety increase.
