
Note: The charts in this commentary have been updated to include the Q2 2016 Third Estimate
The chart below is a way to visualize real GDP change since 2007. It uses a stacked column chart to segment the four major components of GDP with a dashed line overlay to show the sum of the four, which is real GDP itself. Here is the latest overview from the Bureau of Labor Statistics:
The increase in real GDP in the second quarter reflected positive contributions from personal consumption expenditures (PCE), exports, and nonresidential fixed investment. These were partly offset by negative contributions from private inventory investment, residential fixed investment, and state and local government spending. Imports, which are a subtraction in the calculation of GDP, increased.
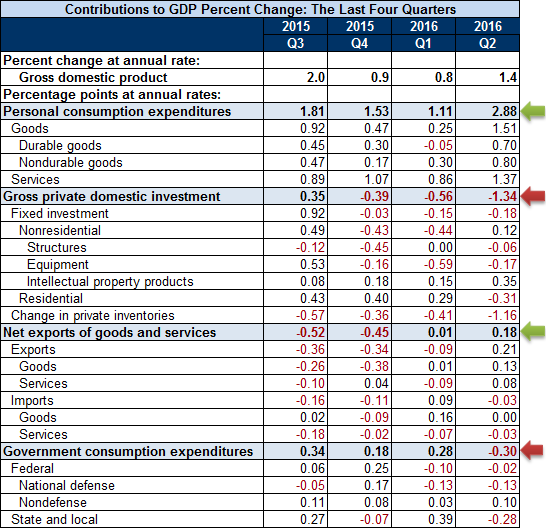
Let's take a closer look at the contributions of GDP of the four major subcomponents. The data source for this chart is the Excel file accompanying the BEA's latest GDP news release (see the links in the right column). Specifically, it uses Table 2: Contributions to Percent Change in Real Gross Domestic Product.

Note: The conventional practice is to round GDP to one decimal place, the latest at 1.4. The GDP in the chart above is the real GDP calculated to two decimal places. In this case rounding made no difference.
Over the time frame of this chart, the Personal Consumption Expenditures (PCE) component has shown the most consistent correlation with real GDP itself. When PCE has been positive, GDP has usually been positive, and vice versa. In the latest GDP data, the contribution of PCE came at 2.88 of the 1.41 real GDP, a dramatic increase over the previous quarter.
The contribution from Gross Private Domestic Investment dropped significantly from the previous quarter.
Net Exports, which is largely impacted by fluctuations in Dollar strength, is fractionally positive. Government expenditures were fractionally negative.
Here is a look at the contribution changes between over the past four quarters. The difference between the two rightmost columns was addressed in the BEA's GDP summary quoted above.
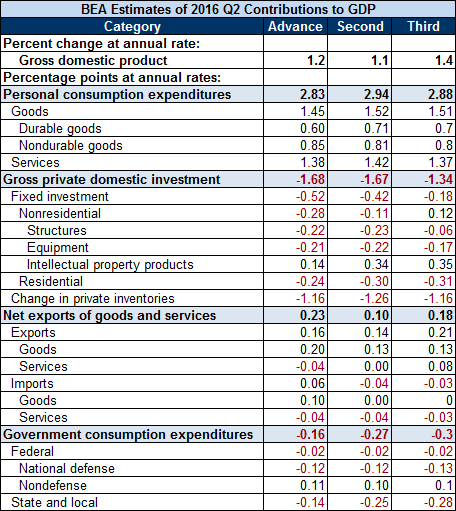
Here is a comparison of the Advance, Second and Third Estimates of Q2 GDP, which enables us to see the direction of the revisions.
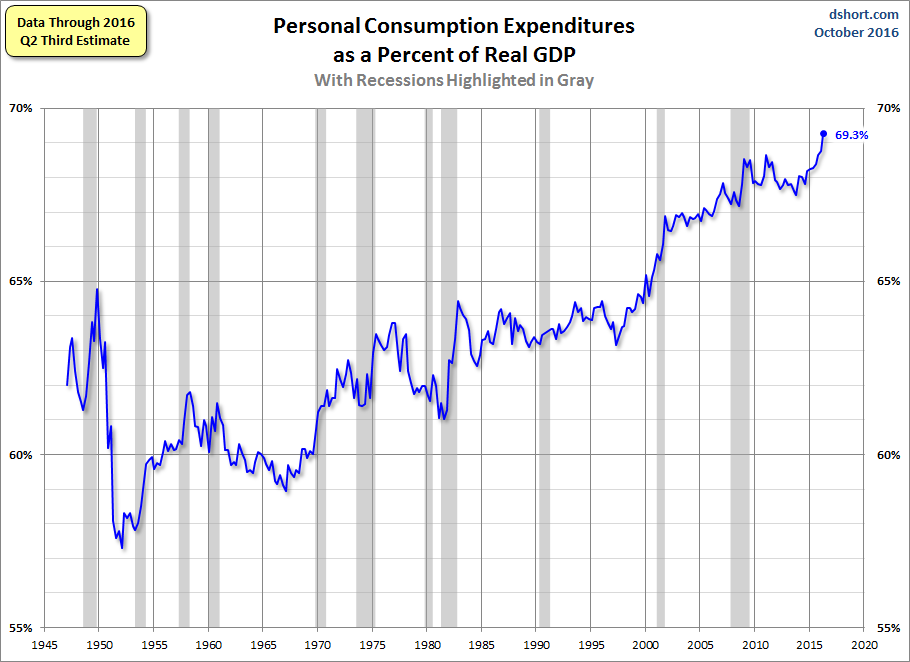
As for the role of Personal Consumption Expenditures (PCE) in GDP and how it has increased over time, here is a snapshot of the PCE-to-GDP ratio since the inception of quarterly GDP in 1947. To one decimal place, latest ratio of 69.3% is a record high. From a theoretical perspective, there is a point at which personal consumption as a percent of GDP can't really go any higher. We may be approaching that upper range.
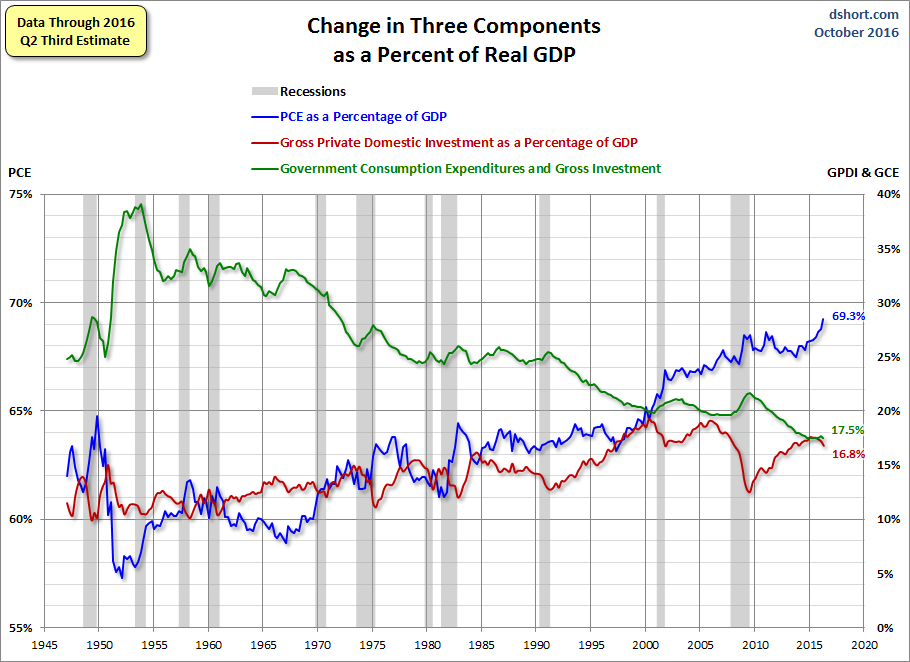
Let's close with a look at the inverse behavior of three of the GPDI components during recessions. PCE and especially GC generally increase as a percent of GDP whereas GPDI declines. Note the three with different vertical axes (Personal Consumption Expenditures on the left, Gross Private Domestic Investment and Government Consumption on the right) to highlight the frequent inverse correlations.
The Advance Estimate for Q3 GDP will be published on October 28.