VeriSign, Inc. (VRSN) is a provider of Internet infrastructure services. The Company provides domain name registry services and infrastructure assurance services. VeriSign segment includes Naming Services, which consists of Registry Services and Network Intelligence and Availability (NIA) Services.
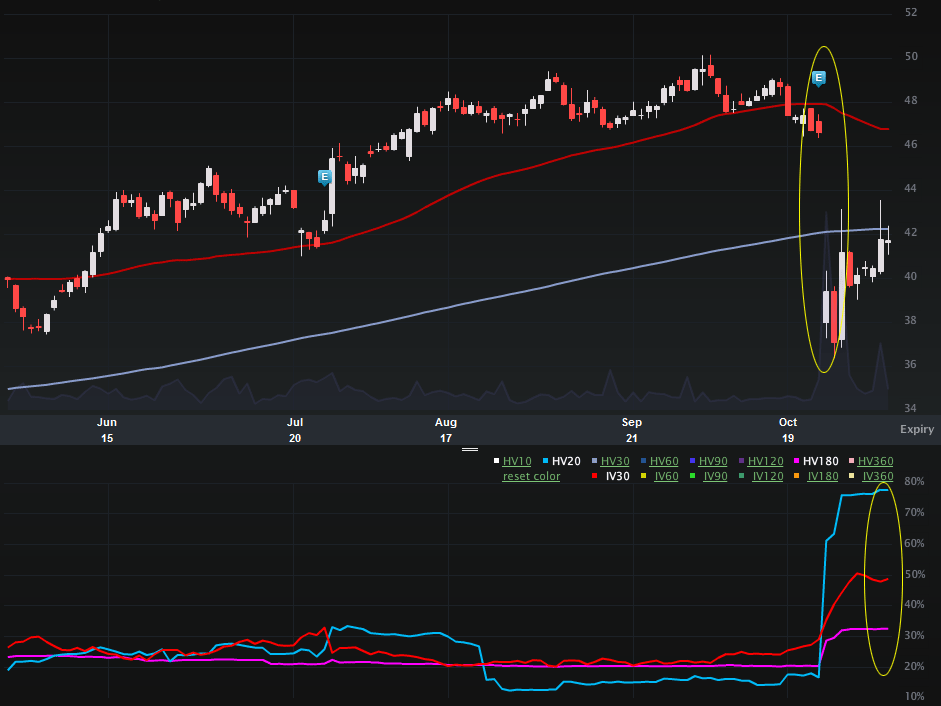
This is a vol note, specifically elevated vol after an earnings move. Let's start with the Charts Tab (six months), below. The top portion is the stock price, the bottom is the vol (IV30™ - red vs HV20™ - blue vs HV180™ - pink).
On the stock side it's pretty easy to see the cataclysm that was the last earnings release. The stock dropped from $46.60 to $39.39 in a day, and then fell to $37.07 the following day. Here's a news snippet from that release:
The big news was that regulators have delayed the review of VeriSign's contract for its domain name registry business. The review was expected to be completed by the end of next month by the Commerce Department, but VeriSign said regulators may not finish on time. That adds major uncertainty in the near-term for what some analysts had considered a "formality." -- Source: The Motley Fool via Yahoo! Finance; Why VeriSign Shares Got Hammered, written by Evan Niu, CFA.
Not only did the stock fall, but that news in fact raised risk (read: vol), and has catapulted VRSN's IV30™ to near annual highs. The 52 wk range in IV30™ is [18.77%, 50.63%], putting the current level in the 94th percentile.
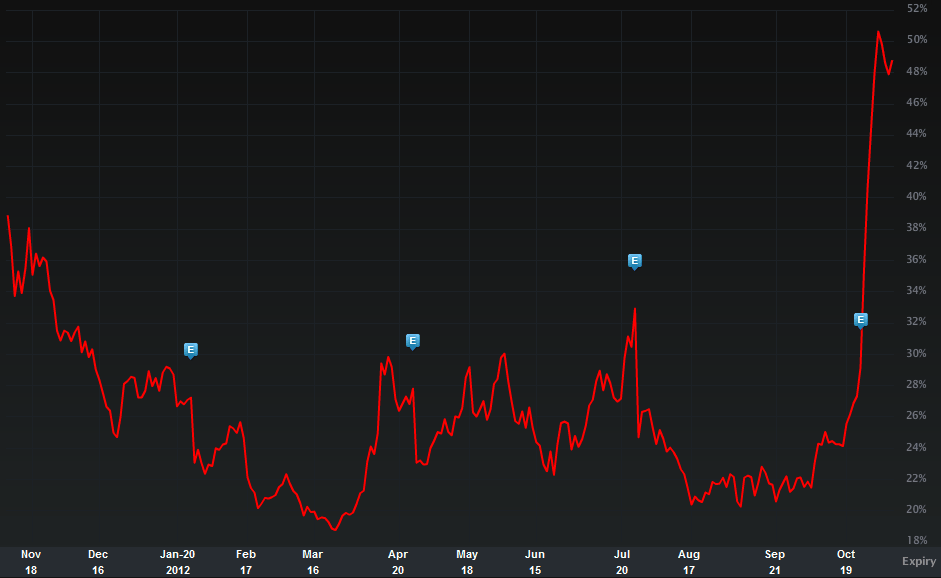
The vol level though is even more impressive when we look at a year chart with IV30™ isolated. I have included that below. 
This chart makes it so much easier to see how elevated and how abruptly the vol has moved on this news. Let's turn to the Skew Tab, below.
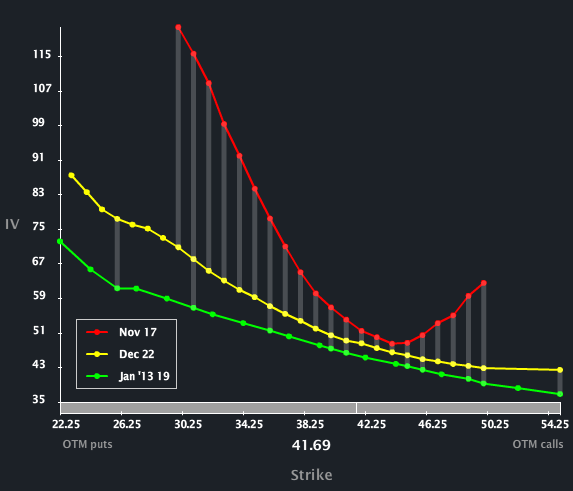
We can see the monotonic increase in vol from the back to the front with a notable parabolic skew shape in the front reflecting both the potential for upside moves and downside moves. I am a bit surprised that Dec or Jan'13 (or both) don't reflect parabolic skew as well. It seems that while risk is certainly elevated, given the stock drop on the news, there is the potential for a stock rise as well... right?...
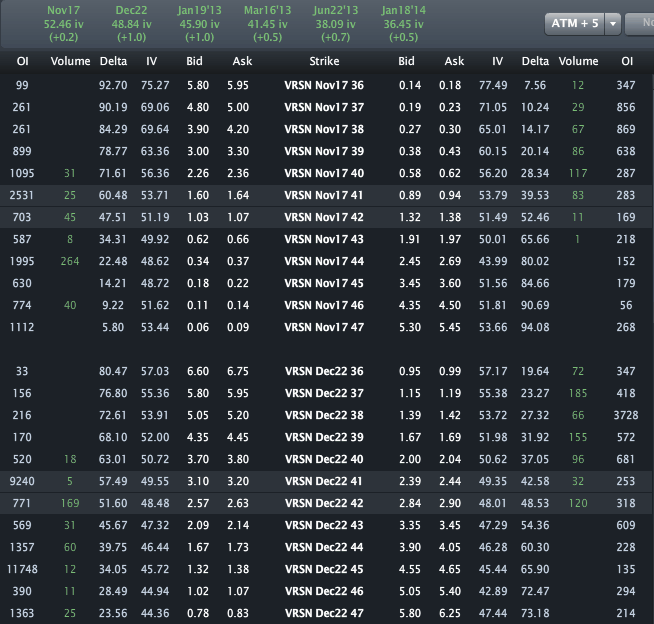
Finally, let's turn to the Options Tab.
Across the top we can see Nov, Dec and Jan'13 are priced to 52.46%, 48.84% and 45.90% vol, respectively. There are really two phenomena I note here:
1. The vol seem low given the news and the impending risk of the next announcement -- I mean, look at that stock reaction...
2. Again, the lack of upside skew in the back months is a little... confounding...
Disclosure: This is trade analysis, not a recommendation
- English (UK)
- English (India)
- English (Canada)
- English (Australia)
- English (South Africa)
- English (Philippines)
- English (Nigeria)
- Deutsch
- Español (España)
- Español (México)
- Français
- Italiano
- Nederlands
- Português (Portugal)
- Polski
- Português (Brasil)
- Русский
- Türkçe
- العربية
- Ελληνικά
- Svenska
- Suomi
- עברית
- 日本語
- 한국어
- 简体中文
- 繁體中文
- Bahasa Indonesia
- Bahasa Melayu
- ไทย
- Tiếng Việt
- हिंदी
VeriSign: Vol Remains in Explosion Territory...But Is It High Enough
Published 11/11/2012, 06:07 AM
Updated 07/09/2023, 06:31 AM
VeriSign: Vol Remains in Explosion Territory...But Is It High Enough
3rd party Ad. Not an offer or recommendation by Investing.com. See disclosure here or
remove ads
.
Latest comments
Install Our App
Risk Disclosure: Trading in financial instruments and/or cryptocurrencies involves high risks including the risk of losing some, or all, of your investment amount, and may not be suitable for all investors. Prices of cryptocurrencies are extremely volatile and may be affected by external factors such as financial, regulatory or political events. Trading on margin increases the financial risks.
Before deciding to trade in financial instrument or cryptocurrencies you should be fully informed of the risks and costs associated with trading the financial markets, carefully consider your investment objectives, level of experience, and risk appetite, and seek professional advice where needed.
Fusion Media would like to remind you that the data contained in this website is not necessarily real-time nor accurate. The data and prices on the website are not necessarily provided by any market or exchange, but may be provided by market makers, and so prices may not be accurate and may differ from the actual price at any given market, meaning prices are indicative and not appropriate for trading purposes. Fusion Media and any provider of the data contained in this website will not accept liability for any loss or damage as a result of your trading, or your reliance on the information contained within this website.
It is prohibited to use, store, reproduce, display, modify, transmit or distribute the data contained in this website without the explicit prior written permission of Fusion Media and/or the data provider. All intellectual property rights are reserved by the providers and/or the exchange providing the data contained in this website.
Fusion Media may be compensated by the advertisers that appear on the website, based on your interaction with the advertisements or advertisers.
© 2007-2024 - Fusion Media Limited. All Rights Reserved.
