
Valmont Industries, Inc. (NYSE:VMI) registered profits of $40.1 million or $1.85 per share in third-quarter 2019, up from $4.4 million or 20 cents in the year-ago quarter.
Barring one-time items, adjusted earnings in the reported quarter came in at $2.09 per share, which trailed the Zacks Consensus Estimate of $2.28.
Revenues in the quarter were $690.3 million, up around 1.7% year over year. The figure missed the Zacks Consensus Estimate of $744.1 million.
Valmont Industries, Inc. Price, Consensus and EPS Surprise
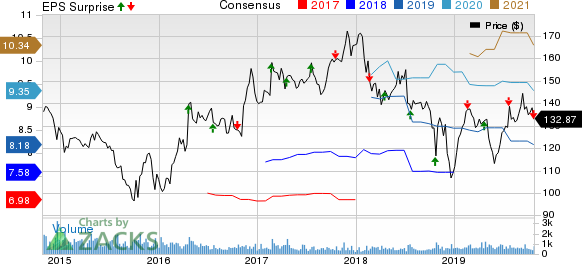
Valmont Industries, Inc. price-consensus-eps-surprise-chart | Valmont Industries, Inc. Quote
Segment Highlights
Infrastructure-Related
Sales in the Engineered Support Structures segment totaled $268.1 million, up around 6.6% year over year. Sales were driven by higher volumes in North America, favorable pricing and acquisitions.
Sales in the Utility Support Structures fell nearly 6.1% year over year to $205 million, as favorable pricing was offset by lower volumes, particularly China. A plant closure in North America earlier this year also affected volumes. Profitability was hurt by modestly lower production levels in North American facilities.
Sales in the Coatings segment rose around 2.8% year over year to $93 million. It was supported by recent acquisitions and pricing discipline, offset by slightly lower volumes in external markets.
Agriculture-Related
Sales in the Irrigation unit amounted to $144.1 million, up around 2.9% year over year. Sales in North America were $82.8 million, up 6% from the year-ago quarter’s figure. Per the company, higher sales of systems, technology solutions and aftermarket parts were offset by lower industrial tubing sales.
International irrigation sales fell around 1% year over year to $61.3 million. Significantly lower volumes in New Zealand and Australia offset the benefits of solid demand from Brazil as well as higher Middle East project sales.
Financial Position
Valmont ended the quarter with cash and cash equivalents of $327.2 million, up roughly 10.7% year over year. Long-term debt at the end of the quarter was $764.5 million, up around 3.1% year over year.
During the first nine months of 2019, operating cash flow rose more than three-folds to $239.2 million.
The company bought back 126,700 shares for $16.8 million in the reported quarter.
Outlook
The company lowered earnings per share expectation for 2019 in the range of $7.05-$7.45 from its prior view of $8.10-$8.70.
Valmont now expects revenue growth of 1-2% year over year in 2019 (down from prior growth expectation of 6-7%).
Capital spending guidance for the year is unchanged from previous forecast of $90-$100 million.
Per the company, North American market demand in Engineered Support Structures and Utility Support Structures unit remains robust. However, Irrigation unit sales are trending roughly 10% below its earlier expectations for 2019.
Moreover, the company expects the recent slowdown in U.S. industrial production to hurt Coatings unit volumes in the fourth quarter. Considering shipment schedules, it does not expect wireless communication sales in the fourth quarter to grow rapidly. However, the company expects continued growth in 2020.
Price Performance
Valmont’s shares have gained around 16% in the past year against the industry’s 17.9% decline.

Zacks Rank & Key Picks
Valmont currently carries a Zacks Rank #3 (Hold).
Some better-ranked stocks in the basic materials space are Kinross Gold Corporation (NYSE:KGC) , Franco-Nevada Corporation (TSX:FNV) and Kirkland Lake Gold Ltd. (TSX:KL) , each sporting a Zacks Rank #1 (Strong Buy). You can see the complete list of today’s Zacks #1 Rank stocks here.
Kinross has an expected earnings growth rate of 210% for 2019. The company’s shares have surged 82.3% in the past year.
Franco-Nevada has a projected earnings growth rate of 39.3% for 2019. The company’s shares have rallied 54.9% in a year’s time.
Kirkland Lake Gold has an estimated earnings growth rate of 93.4% for the current year. Its shares have moved up 134.3% in the past year.
5 Stocks Set to Double
Each was hand-picked by a Zacks expert as the #1 favorite stock to gain +100% or more in 2020. Each comes from a different sector and has unique qualities and catalysts that could fuel exceptional growth.
Most of the stocks in this report are flying under Wall Street radar, which provides a great opportunity to get in on the ground floor.
Today, See These 5 Potential Home Runs >>
Kinross Gold Corporation (KGC): Free Stock Analysis Report
Franco-Nevada Corporation (FNV): Free Stock Analysis Report
Valmont Industries, Inc. (VMI): Free Stock Analysis Report
Kirkland Lake Gold Ltd. (KL): Free Stock Analysis Report
Original post