
Swing traders rely on a diverse arsenal of technical indicators when analyzing stocks and there are literally hundreds of indicators to choose from. But how is a new trader supposed to know which indicators are most reliable? Deciding which technical indicators to use can frankly be a bit overwhelming, but it doesn’t have to be (nor should it).
Fous On The Basics
While learning to master our winning system for swing trading stocks and ETFs in the early years, we tested a plethora of technical indicators. Our conclusion was that most of the technical indicators served their intended purpose of increasing the odds of a profitable stock trade. However, we quickly discovered that using too many indicators only led to analysis paralysis. As such, we now avoid this problem by simply focusing on the tried and true basics of technical trading: price, volume, and support/resistance levels.
One of the easiest and most effective ways to find support and resistance levels is through the use of moving averages. Moving averages play a very big role in our daily stock analysis, and we rely heavily on certain moving averages to locate low-risk entry and exit points for the stocks and ETFs we swing trade.
Gauging Price Momentum
For gauging price momentum in the very short-term (a period of several days), we have found the five- and 10-day moving averages work very well. If, for example, a stock or ETF is trading above its five-day MA, there is usually no good reason to sell. One possible exception is if the stock or ETF has made a 25-30% price advance within just a few days.
The 10-day MA is a great moving average for helping us ride the trend with a bit more “wiggle room” than provided by the ultra short-term five-day MA.
Cases In Point
For trend traders, no stocks or ETFs should be sold while they are still trading above their 10-day moving averages following a strong breakout. To understand why, compare the following daily charts of U.S. Oil Fund (USO) and First Trust DJ Internet Index Fund (FDN). First is FDN: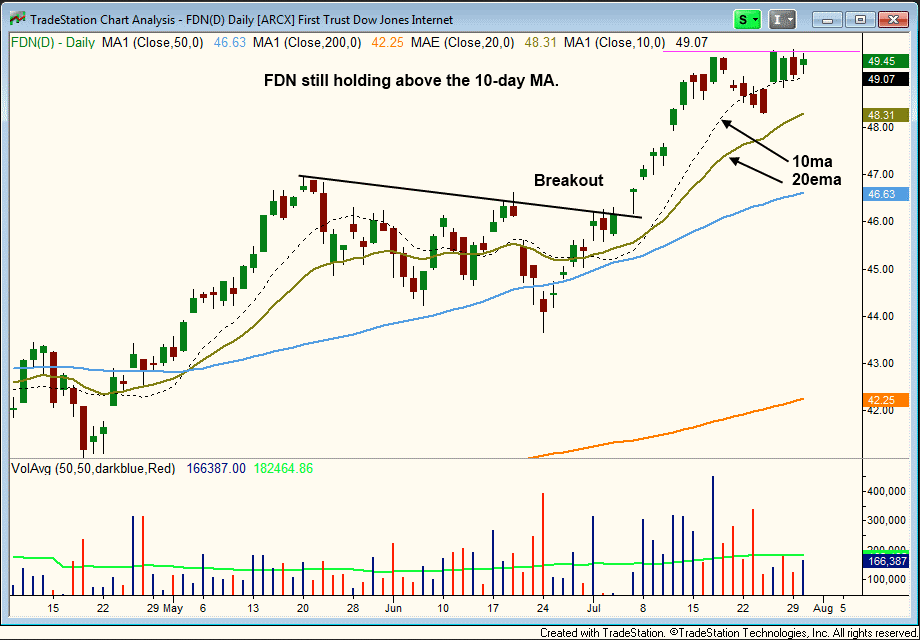
With the exception of a brief “shakeout” of just two days (a common and acceptable occurrence), notice that FDN has been holding above its rising 10-day MA ever since breaking out in early July. This is a clear sign that the momentum from the breakout is still strong.
On the other hand, notice the difference on the daily chart of USO: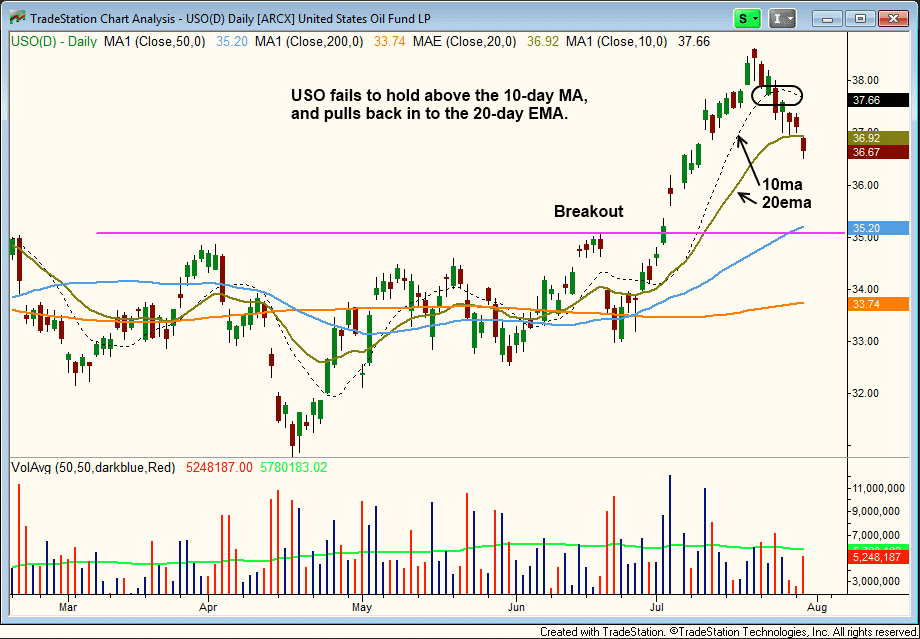
As you can see, USO has failed to hold above its 10-day MA over the past week, which is a sign that bullish momentum from the recent breakout is fading. As such, we sold 25% of our existing position on July 25. It never hurts to lock in profits on partial share size when a breakout stock or ETF has broken below its 10-day moving average, as such price action frequently leads to a deeper correction.
Immediately after selling partial share size on the break of the 10-day MA, we were prepared to buy back those shares if the price action immediately snapped back higher within one to two days (as FDN did). However, since that did not occur, we canceled our buy stop and continue to hold USO with reduced share size and a small unrealized gain since the breakout entry.
Tracking The Trend
While the five- and 10-day moving averages are by no means a complete and perfect system for exiting a position, they allow us to stay with the trend in a winning trade (which helps us to maximize our trading profits). More importantly, using the 10-day moving average as a short-term indicator of support enables us to TRADE WHAT WE SEE, NOT WHAT WE THINK.
- English (UK)
- English (India)
- English (Canada)
- English (Australia)
- English (South Africa)
- English (Philippines)
- English (Nigeria)
- Deutsch
- Español (España)
- Español (México)
- Français
- Italiano
- Nederlands
- Português (Portugal)
- Polski
- Português (Brasil)
- Русский
- Türkçe
- العربية
- Ελληνικά
- Svenska
- Suomi
- עברית
- 日本語
- 한국어
- 简体中文
- 繁體中文
- Bahasa Indonesia
- Bahasa Melayu
- ไทย
- Tiếng Việt
- हिंदी
Using The 10-Day Moving Average: A Primer
Published 07/31/2013, 10:13 AM
Updated 07/09/2023, 06:31 AM
Using The 10-Day Moving Average: A Primer
3rd party Ad. Not an offer or recommendation by Investing.com. See disclosure here or
remove ads
.
Latest comments
what is ETF? pL. Explain
Install Our App
Risk Disclosure: Trading in financial instruments and/or cryptocurrencies involves high risks including the risk of losing some, or all, of your investment amount, and may not be suitable for all investors. Prices of cryptocurrencies are extremely volatile and may be affected by external factors such as financial, regulatory or political events. Trading on margin increases the financial risks.
Before deciding to trade in financial instrument or cryptocurrencies you should be fully informed of the risks and costs associated with trading the financial markets, carefully consider your investment objectives, level of experience, and risk appetite, and seek professional advice where needed.
Fusion Media would like to remind you that the data contained in this website is not necessarily real-time nor accurate. The data and prices on the website are not necessarily provided by any market or exchange, but may be provided by market makers, and so prices may not be accurate and may differ from the actual price at any given market, meaning prices are indicative and not appropriate for trading purposes. Fusion Media and any provider of the data contained in this website will not accept liability for any loss or damage as a result of your trading, or your reliance on the information contained within this website.
It is prohibited to use, store, reproduce, display, modify, transmit or distribute the data contained in this website without the explicit prior written permission of Fusion Media and/or the data provider. All intellectual property rights are reserved by the providers and/or the exchange providing the data contained in this website.
Fusion Media may be compensated by the advertisers that appear on the website, based on your interaction with the advertisements or advertisers.
© 2007-2024 - Fusion Media Limited. All Rights Reserved.