It’s the dollar’s world; we all just live in it.
The US dollar tagged a new 12-year high at 98.50 in today’s European session on the continued positive afterglow from Friday’s NFP report and growing concerns about the impact of Greece’s struggles on the wider Eurozone economy. As we noted in our NFP Instant reaction report, the jobs report “only strengthen[s] the “King Dollar” trade heading into the Federal Reserve’s highly-anticipated March monetary policy meeting.” Though US 10yr yields are pulling back a bit today, they have surged a staggering 70bps from February’s lows near 1.60% to the current 2.15% on expectations of earlier Fed tightening. In this environment of low yields across the globe, the US yield advantage could drive the dollar index to the psychologically significant 100.00 level sooner rather than later.
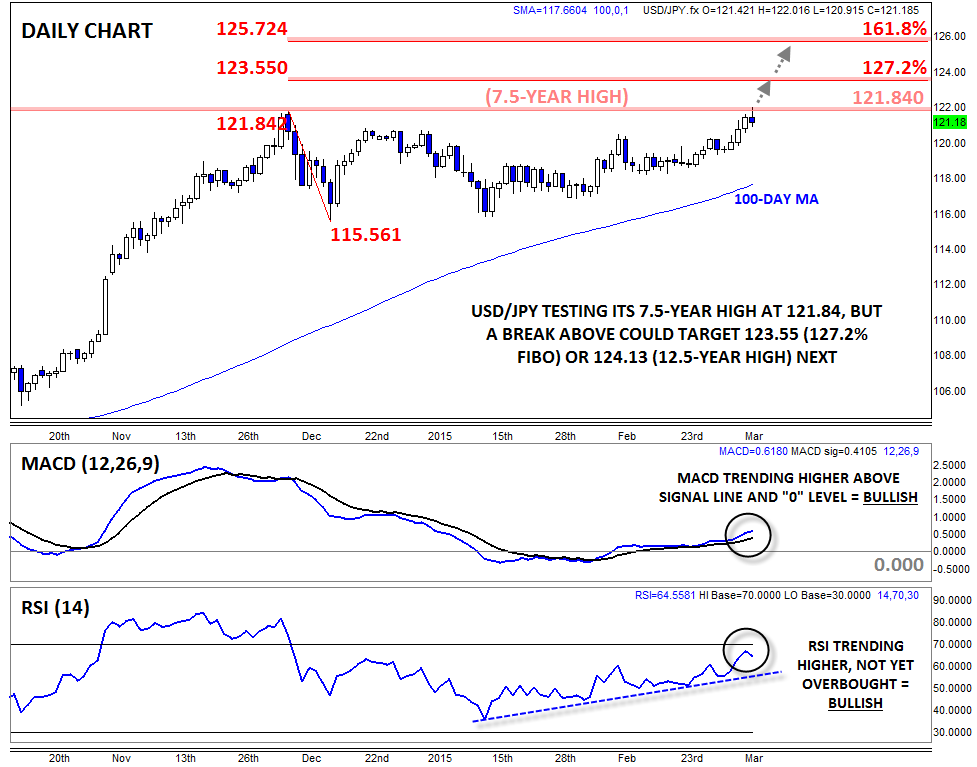
While EURUSD is understandably garnering all the headlines today, USDJPY is also on the verge of a major breakout above its 7.5-year high at 121.84. Beyond the broad-based dollar strength, USDJPY’s close correlation with the Nikkei equity index is also driving the pair higher. Historically, the performance of USDJPY has provided a reliable proxy for global equity markets and risk assets as a whole. This correlation makes sense: when traders are feeling more optimistic (high risk appetite), they tend to buy stocks and sell yen to fund carry trades in higher-yielding currencies, but when they are more pessimistic (risk averse), traders have to unwind these trades by buying back yen and selling equities.
Beyond the general risk relationship, the correlation between USDJPY and Japan’s Nikkei 225 index is further strengthened by the index’s heavy weighting in export-oriented companies. When the value of the yen rises (USDJPY falls), Japanese exporters see reduced demand from overseas buyers. On the other hand, a fall in the value of the yen (USDJPY rise) makes Japanese goods “cheaper” for foreigners, boosting Japanese sales and driving Japanese shares higher. As the chart below shows, this correlation has been reliable since Q4 of last year, though of course there is no guarantee that it will stay as consistent in the future. In fact, based on the chart below, the current level of the Nikkei (18,500) would be consistent with USDJPY trading closer to 124.00 than its current level of 121.00.

Turning our attention to more traditional technical analysis, USDJPY is testing its aforementioned 7.5-year high at 121.84 as we go to press, but there are some signs that this barrier could give way this week. For one, the MACD indicator is trending higher above its signal line and the “0” level, showing bullish momentum. Meanwhile, the RSI indicator has been trending higher since mid-January and is not yet overbought, leaving the door open for another leg higher.
If USDJPY is able to close above the 121.84 level, a continuation toward the 127.2% Fibonacci retracement of December’s pullback at 123.55 could be in play, followed by a potential move up to the 12.5-year high at 124.13. Regardless, the short-term bullish bias will remain intact as long as rates stay above the psychologically-significant 120.00 level.

