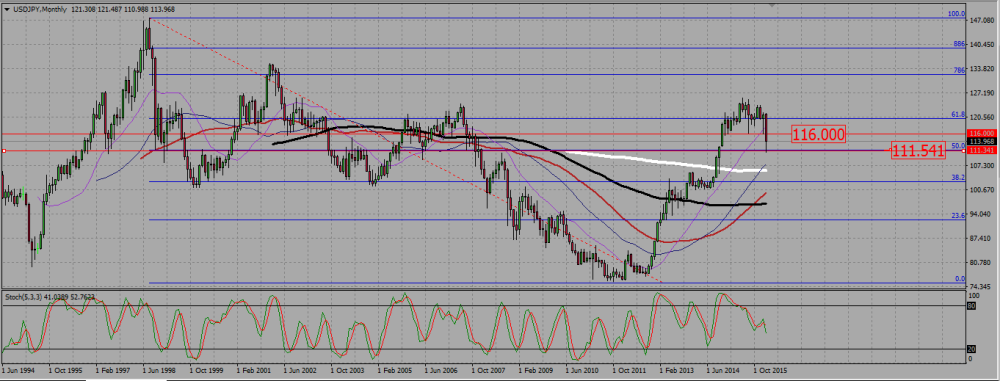
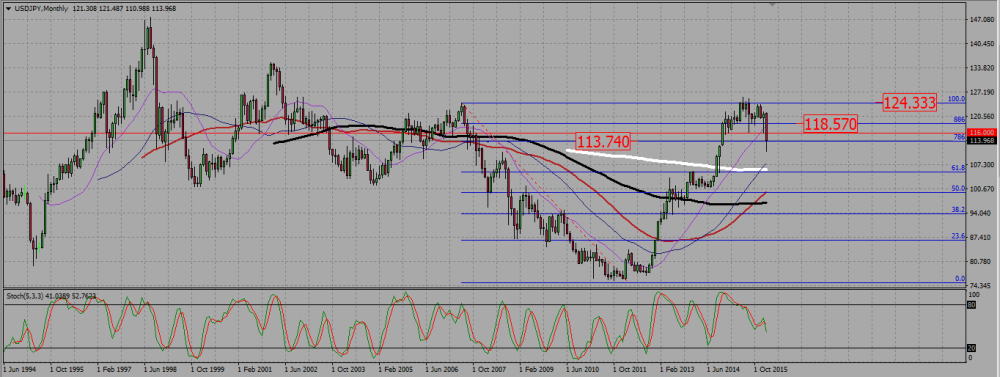
Under 118,5, sell signals to go to 111,5. Buy above 118,5 as we are still in a monthly uptrend. On the monthly chart, there is a very powerful bearish candle that broke a strong support around 116. That pair is probably going down, but it is prevented from it by a 0,50 Fibonacci support line around 111,5 -monthly chart 1-. On another monthly Fibonacci retracement, there is another level that is supportive: a 0,786 around 113,75 -monthly chart 2-. The 0,886 level is around 118,5, and this is the last resistance under which I will keep a bearish bias.
USD/JPY MONTHLY CHART 1
USD/JPY MONTHLY CHART 2
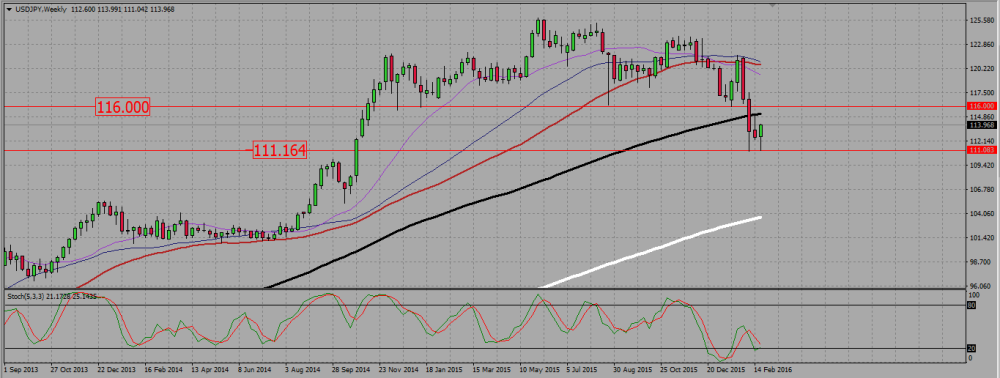
The weekly chart shows us an uptrend consolidating down. Please note the potential double bottom around 111 and the last weekly candle forming a hammer - it suggests we are going back up. However, the bearish correction is very strong -see the two huge bearish candles-, and ProfitF thinks any bullish move will be rather short lived, and that the yen will turn bearish again after that to retest the 111,5 support. This is why I am keeping a bearish bias, although I am expecting the pair to start the week up.
USD/JPY WEEKLY CHART
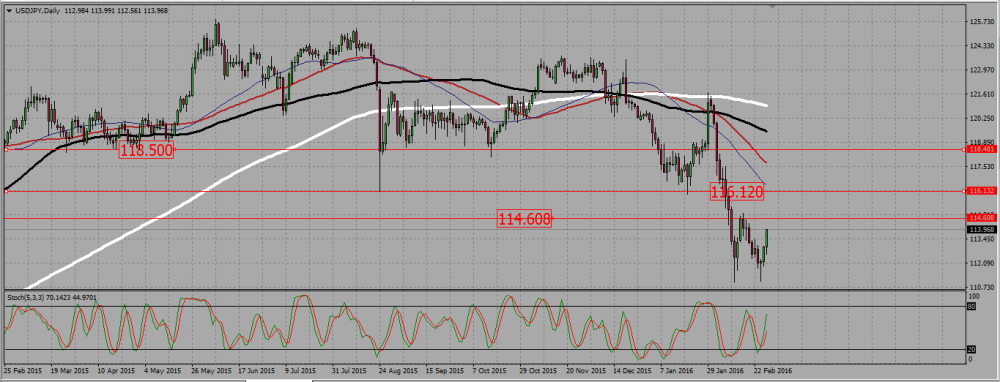
The daily chart shows a downtrend, with all SMAs pointing down, but there is that double bottom around 111, followed by a hammer and then two strong bullish candles. I am expecting this rally to keep on a little but, as it is counter trend on that chart, ProfitF prefers to sell into resistances (114,5 ,116,1, or 118,5 for instance) to go back down and retest the double bottom near 111.
USD/JPY DAILY CHART