Get 40% Off
🔥 This hedge fund gained 26.16% in the last month. Get their top stocks with our free stock ideas tool.See stock ideas

USD/JPY: Heading In Sideways Direction

Published 01/25/2016, 05:49 AM
Updated 07/09/2023, 06:31 AM
EUR/USD
-
USD/JPY
-
USD/CHF
-

USD/JPY

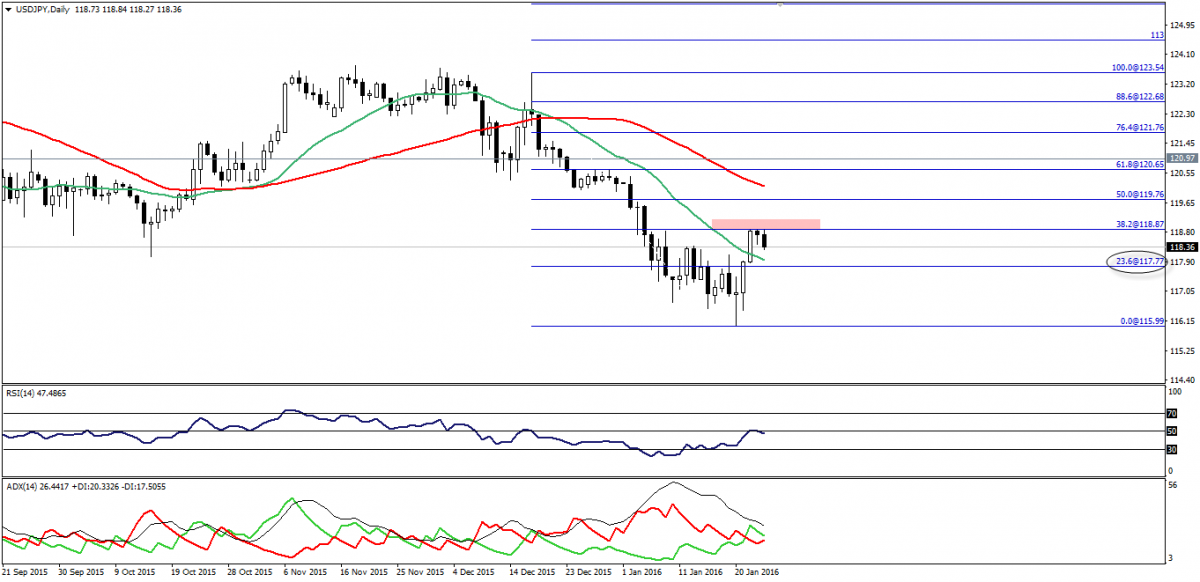
USD/JPY has edged lower touching our previous technical target for the recovery at 38.2% Fibonacci as seen on the provided daily chart.
USD/JPY Daily Chart

Trading between SMA20-green- and SMA50 –red- makes it hard to be bullish more, while coming below 23.6% Fibonacci will bring the bearishness back into focus, as it will affirm the momentum resistance on RSI.

The levels to watch are 117.65 and 118.90 and a break of one of them will clear the next big move.

Support: 117.90-117.60-117.30

Resistance: 118.90-119.05-119.30

Direction: Sideways

USD/CHF

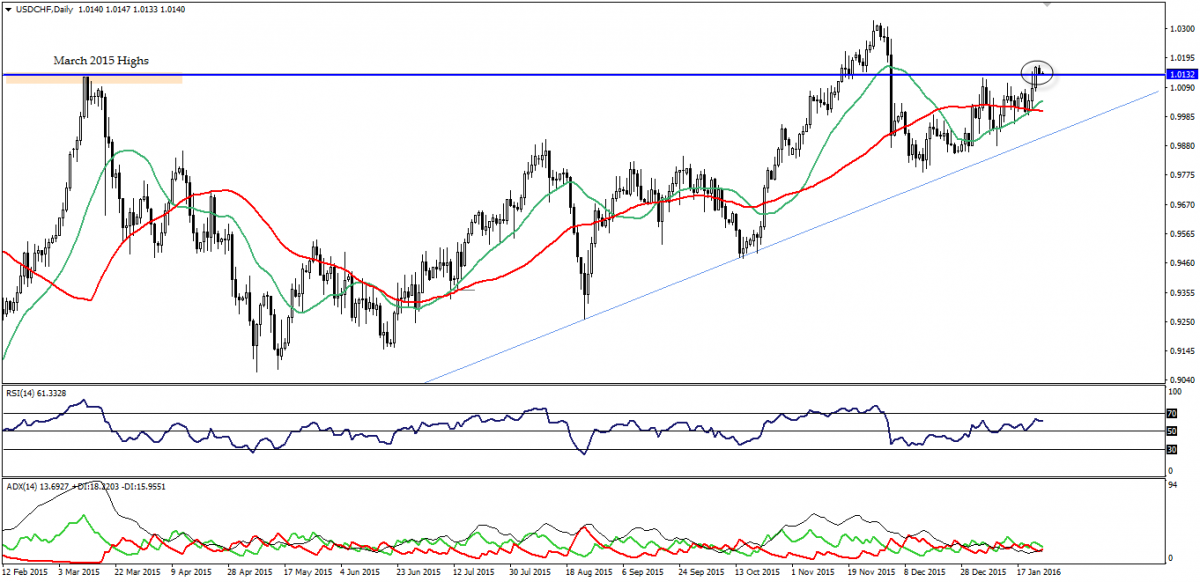
Right now, the USD/CHF pair is trading at 1.0130 resistances where March 2015 highs exist.
USD/CHF Daily Chart

This level is very sensitive and we don’t want to be trapped in a false breakout process, as Friday’s closing was achieved above 1.0130.

ADX also remains weak and couldn’t present the signal that we can depend on to follow through.

We will be on the sidelines now until the pair proves a real breakout or offering false break to pinpoint the next move.

Support: 1.0100-1.0050-1.0030

Resistance: 1.0180-1.0220-1.0275

Direction: Sideways

EUR/USD

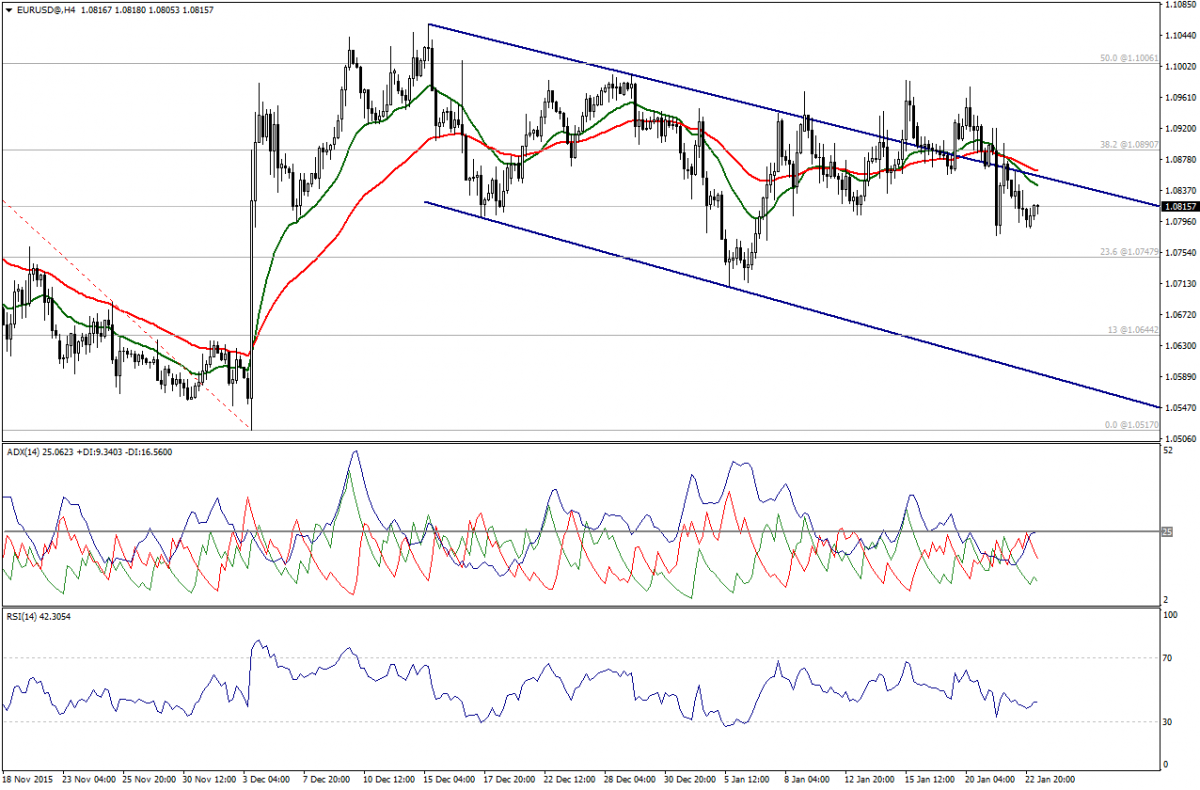
Euro hovers around 1.0800 despite the major negativity seen earlier with trading below 1.0890 and below moving averages, but ADX shows decrease in bears’ power.
EUR/USD Chart

We will be on the sidelines to see how the pair will behave around 1.0800 and we need stable move below moving averages along with a four-hour closing below 1.0790 to be bearish.

Support: 1.0800 – 1.0745 – 1.0700

Resistance:1.0890 –1.0935 – 1.0985

Direction: Sideways

Latest comments

Risk Disclosure: Trading in financial instruments and/or cryptocurrencies involves high risks including the risk of losing some, or all, of your investment amount, and may not be suitable for all investors. Prices of cryptocurrencies are extremely volatile and may be affected by external factors such as financial, regulatory or political events. Trading on margin increases the financial risks.
Before deciding to trade in financial instrument or cryptocurrencies you should be fully informed of the risks and costs associated with trading the financial markets, carefully consider your investment objectives, level of experience, and risk appetite, and seek professional advice where needed.
Fusion Media would like to remind you that the data contained in this website is not necessarily real-time nor accurate. The data and prices on the website are not necessarily provided by any market or exchange, but may be provided by market makers, and so prices may not be accurate and may differ from the actual price at any given market, meaning prices are indicative and not appropriate for trading purposes. Fusion Media and any provider of the data contained in this website will not accept liability for any loss or damage as a result of your trading, or your reliance on the information contained within this website.
It is prohibited to use, store, reproduce, display, modify, transmit or distribute the data contained in this website without the explicit prior written permission of Fusion Media and/or the data provider. All intellectual property rights are reserved by the providers and/or the exchange providing the data contained in this website.
Fusion Media may be compensated by the advertisers that appear on the website, based on your interaction with the advertisements or advertisers.
© 2007-2024 - Fusion Media Limited. All Rights Reserved.