
A week ago, USD/CAD was barely holding above 1.3100. The pair was still in the doldrums following a steep decline from its late-December high of 1.3665 and it appeared the bears had no intention of leaving. But in order to confirm their ambitions to drag USD/CAD even lower, they first had to deal with the 1.3069 key level.
This figure was important for two reasons. First, it was the last registered bottom. And second, it was the invalidation level of the bullish Elliott Wave chart below, which our clients received as a short-term update on Wednesday, Feb. 27.
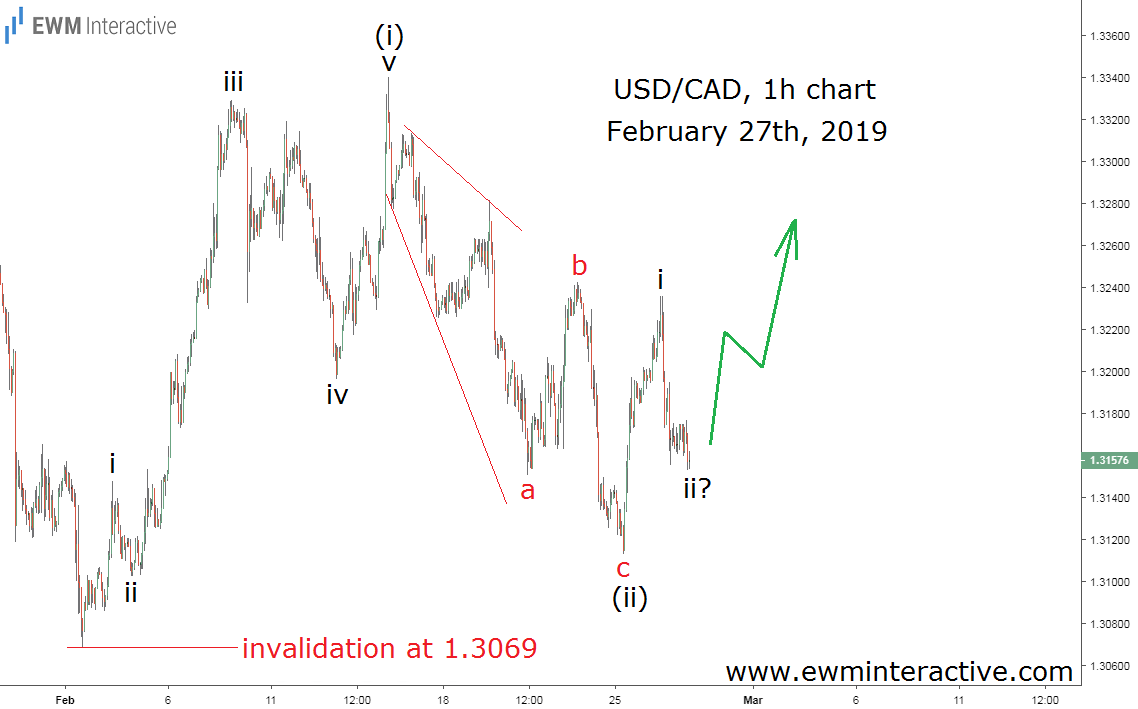
The hourly chart of USD/CAD revealed that the recovery from 1.3069 to 1.3340 was a five-wave impulse pattern, labeled i-ii-iii-iv-v in wave (i). This, in turn, meant the following decline was supposed to be a simple a-b-c zigzag correction with an expanding leading diagonal in wave “a”.
USD/CAD Bulls Stay in Charge
According to the theory, once we have a complete 5-3 wave cycle like the one just described, we can prepare for the larger trend to resume in the direction of the five-wave sequence. It is true that wave (ii) was a very deep retracement, but as long as the pair was trading above the starting point of wave (i) at 1.3069, there was no reason to give up on the positive outlook. A week later today, we now know who won the battle for USD/CAD.
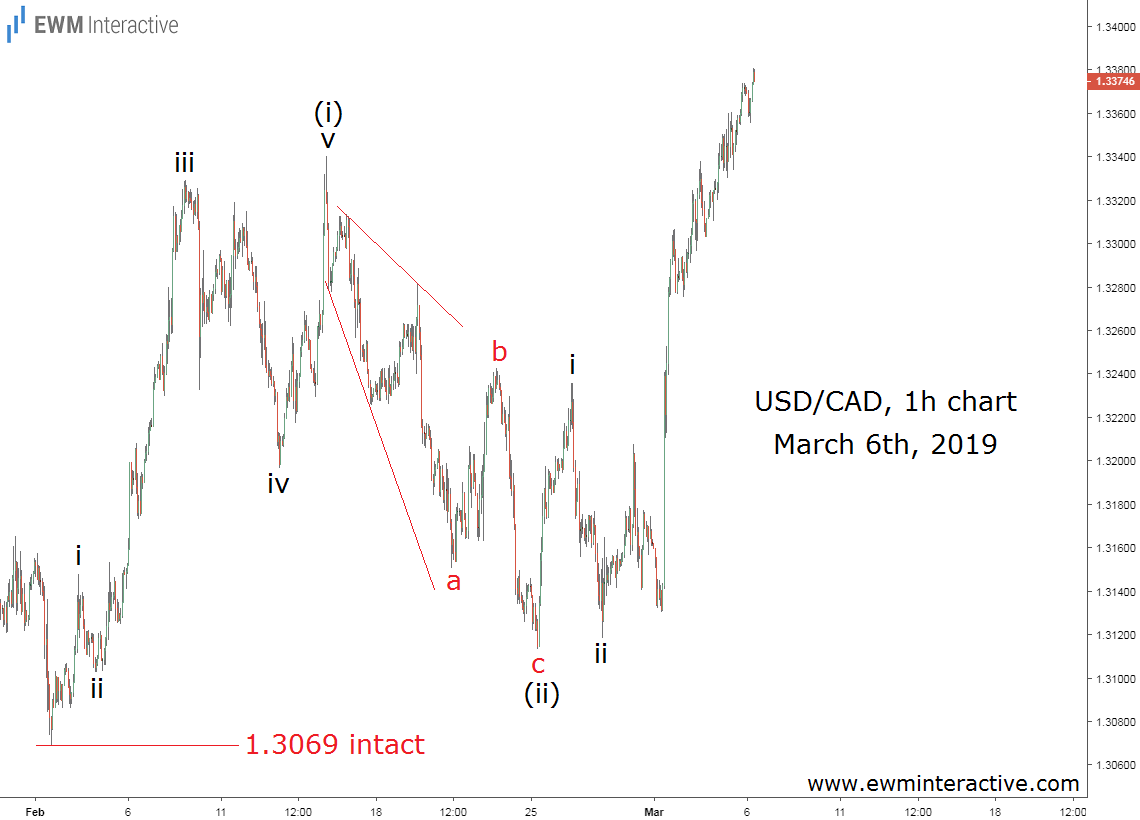
Shortly after our analysis, the pair dipped to 1.3118, which was the best the bears managed to achieve. As of this writing, USD/CAD is trading around 1.3370, up over 250 pips in just a week.
Of course, there is nothing certain in the markets. Even the best Elliott Wave analyst cannot be sure of anything. In USD/CAD’s case, the situation might have been a lot different now, if the bears were only able to breach 1.3069.
That is how Elliott Wave analysts deal with uncertainty. If a specific level is broken, this means the primary count was wrong and you have to switch to an alternative one. With USD/CAD there was no need for a change in plans since the pair never fell below 1.3069.