The yen was little changed after the end of the Bank of Japan meeting, which kept its monetary policy steady. The Bank of Japan will continue to pump 60 to 70 trillion yen (on average 620 billion dollars) at an annual pace into Japanese financial markets in a bid to raise inflation to 2%.
The USD/JPY was under the 105 level at 104.83, having topped out at 105.31 the previous day. The EUR/JPY was at 137.82, having briefly climbed above the 138 level during the previous day’s US session. Trading in the other majors was relatively quiet in anticipation of key events today and tomorrow. The euro was eagerly awaiting the verdict from the European Central Bank’s meeting as well as Draghi’s press conference later today. According to some analysts, the risk was that the ECB could under-deliver after Draghi’s remark in Jackson Hole that investors’ inflation expectations were being lowered. This was reflected in recent trading of the euro, as the market was reluctant to push it to fresh lows. The EUR/JPY was trading around 1.3150.
The euro was also helped by reports that there would be a ceasefire in Ukraine. There were however conflicting reports as to what exactly was agreed and with whom, so the reaction to the news was cautious. Unfortunately there have been various instances in the 6-month conflict that have seen hopes of an end to the conflict lead to nowhere concrete. The dollar was also trading cautiously ahead of Friday’s employment report. Today, reports out of the US include the ADP private employment survey as well as the services ISM for August, which is expected to hold near its 8 ½ year high. It should be kept in mind that the manufacturing ISM was also good news for the US economy and hence the US dollar, on Tuesday.
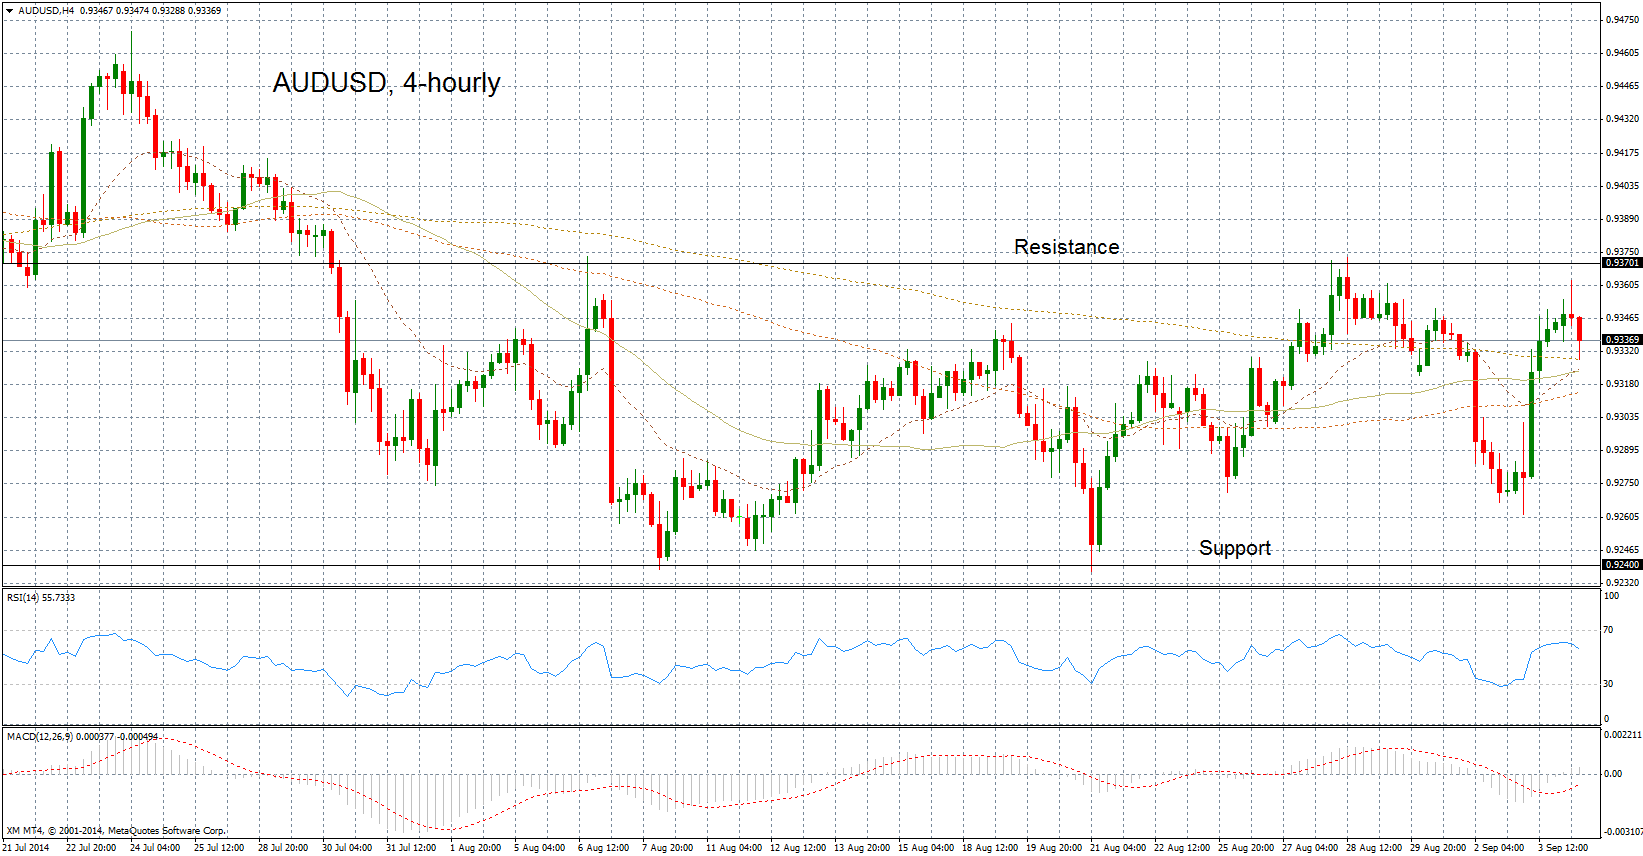
AUD/USD range-bound, struggling to find direction against USD
The Australian dollar has been the best performing developed country currency of the year-to-date, rising by 4.7% against the greenback. However, that rally took place between January and mid-April earlier in the year and the aussie has since been marking time more or less, as two attempts to overrun the 0.9450 – 0.9500 level have failed.
For the past 5 weeks, the aussie has spent time between the 0.9240 level on the downside and 0.9370 and those would be key levels to watch for traders wanting to catch an upside or downside breakout.
The Relative Strength Index is around 50, which is neutral, while the MACD is bullish as the indicator is above the red signal line and slightly positive.
Price action is above the 200-day moving average (at 0.9178) and this level could also act as support on any selling attempts.
Overall there is no clear trend for their pair. The long side should be preferred to the short side as the pair could also be consolidating before continuing its prior positive move higher, but for now the 0.9240-0.9370 range appears to hold and confirmation is needed before longs are initiated.
