The US dollar registered some sharp gains, as economic data released out of the United States, supported the case in favor of a recovering US economy and tighter monetary policy, in contrast to other developed economies such as the Eurozone and Japan. The previous day's non-manufacturing (or services) ISM number climbed to its highest in 9 years. Thedollar's outsized gains came after the European Central Bank cut its key target rate by 0.10% to lower it to 0.05% and said that it would start a purchase program of Asset Backed Securities made up of loans to the non-financial private sector. The ECB actions surprised the markets and led to a huge sell-off in the euro. EUR/USD lost in excess of 200 pips in the aftermath of the ECB’s decision and the US data. It traded as low as 1.2920 – its lowest since July of 2013 and well below the psychologically important 1.30 level. Data out of Eurostat later today are expected to confirm that the Eurozone economy stagnated during the second quarter. The yen also lost ground against the greenback although in not as dramatic a fashion as the euro. USD/JPY climbed to 105.71, surpassing the early January high of 105.44, to climb to its highest since October 2008. Kuroda’s comments the previous day that additional yen weakness was not necessarily a bad thing, weighed on the Japanese currency, during a day that the dollar was strong across the board. Looking ahead, today’s key release will be the US employment report. Nonfarm payrolls are expected to climb by 225 thousand – above the 200,000 mark for the seventh consecutive month. Unemployment should dip to 6.1% from the previous month’s 6.2%. Sentiment towards the dollar remains positive and good numbers could fuel further dollar gains, although some profit-taking after such large moves is also to be expected at some point.
Technical Analysis – EUR/USD Weekly: after 1.30, what’s next?
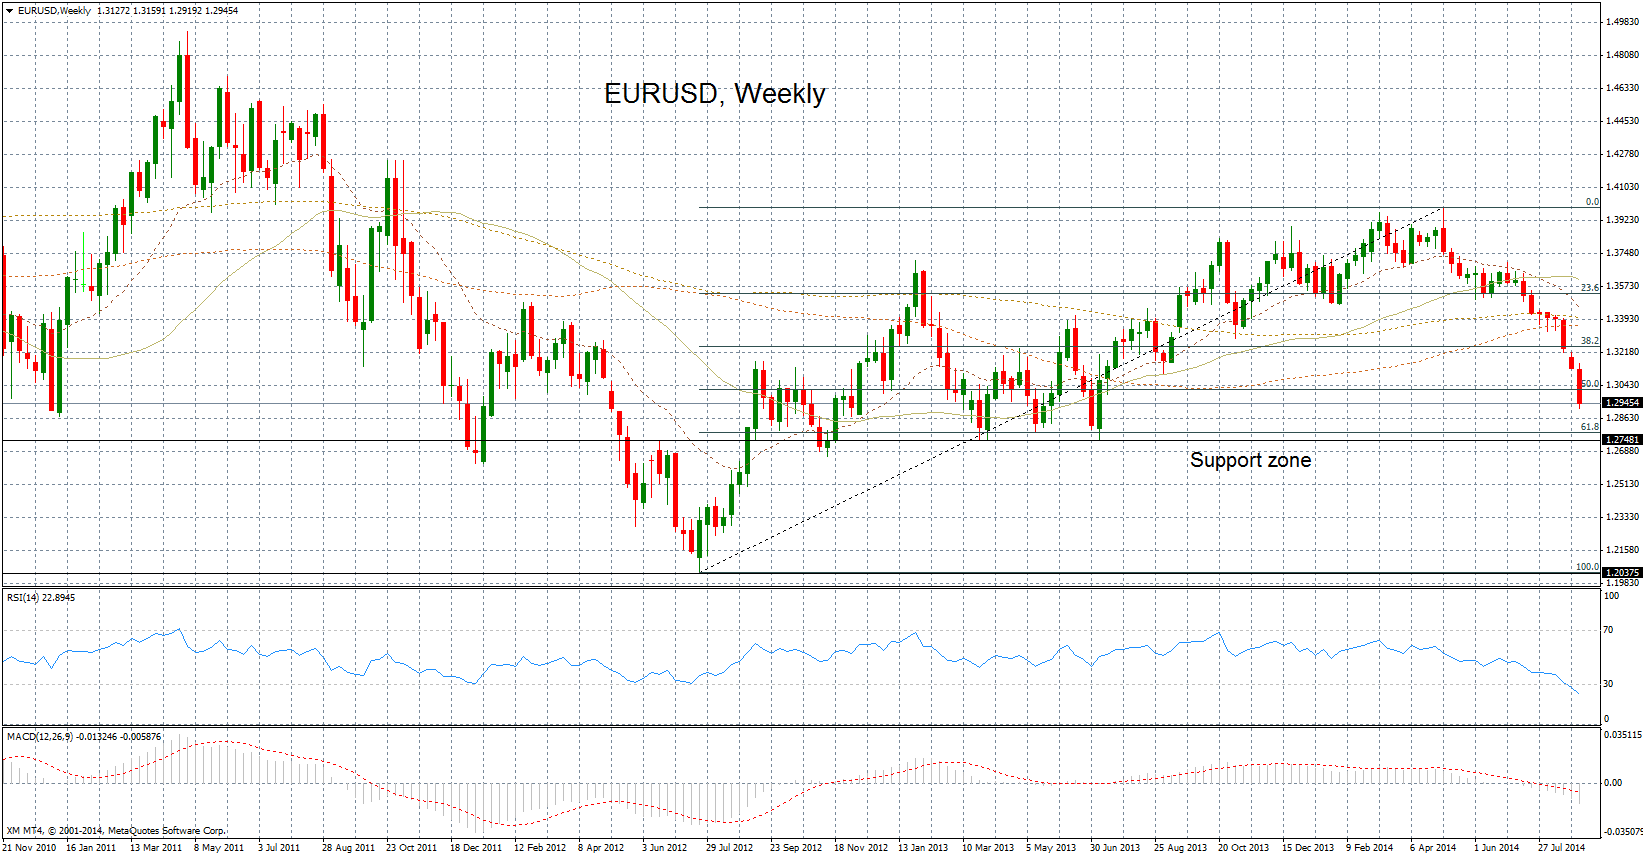
The rapid descent of the euro against the dollar from the 1.3992 level in early May (a near 3-year high), to below 1.30, forces traders to turn to longer-term charts in order to find important technical areas that could act as support. After the euro broke the psychologically important 1.30 level, it registered a low at 1.2920, which is the lowest since July of 2013 – a 13-month low. Looking at the chart, the next important level is 1.2750. This level was tested successfully multiple times, in June / July of 2013 and March of 2013 as it managed to contain the correction of the then upwardly trending euro. Around 1.28 is another important level, as it represents the 61.8% Fibonacci retracement of the entire rally from 1.2040 to 1.3992. It is worth remarking that 1.30 was close to the 50% Fibonacci retracement. Therefore the next possible ‘stop’ for euro / dollar bears is the 1.2750-1.2800 area. However, before reaching that level, it should also be pointed that the RSI is flashing oversold signals, both on the weekly and the daily charts. Of course an extremely strong trend can often ignore such signals and press on, but then ensuing comebacks can also be brutal. Therefore, as the dollar has already made significant gains recently, it is perhaps better to buy it on dips rather than expose oneself to potentially damaging pullbacks.
