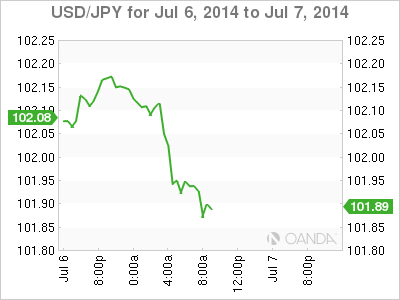
USD/JPY has posted slight losses on Monday, as the pair trades slightly below the 102 line in the European session. It's a quiet start to the week, with no US releases on the schedule. In Japan, the Leading Indicators index dropped slightly, slipping to its lowest level in a year. Later in the day, we'll get a look at Current Account. The markets are expecting a second consecutive surplus in the June reading.
US employment numbers were the perfect prelude to a long holiday weekend in the US, as Nonfarm Payrolls and the Unemployment Rate sparkled. Nonfarm Payrolls, one of the most important indicators, bounced back in June with a strong gain of 288 thousand new jobs. This crushed the estimate of 214 thousand. Unemployment Claims was steady at 315 thousand, almost replicating the estimate of 314 thousand. There was more good news from the Unemployment Rate, which continues to move downward. The indicator dipped to 6.1%, its lowest level since September 2008. The strong employment numbers are sure to increase speculation about an interest rate hike by the Federal Reserve, and remarks by Fed policymakers will be under the market microscope.
The Tankan indices are key indicators of the health of the Japanese manufacturing and services sectors, and highly anticipated by the markets. The May data was disappointing, as both indices softened. Tankan Manufacturing Index slipped to 12 points, a three-month low. This was well short of the estimate of 16 points. The Tankan Non-Manufacturing Index dropped to 19 points, down from 24 points a month earlier. On a positive note, this matched the estimate.

USD/JPY July 7 at 11:40 GMT
- USD/JPY 101.93 H: 102.20 L: 101.90
USD/JPY Technicals
| S3 | S2 | S1 | R1 | R2 | R3 |
| 99.57 | 100.00 | 101.19 | 102.53 | 103.07 | 104.17 |
- USD/JPY has shown little movement in the Asian and European sessions. The pair touched a high of 101.96 earlier in the European session.
- 102.53 is the next line of resistance. 103.07 is stronger.
- 101.19 is providing support. The next support level is the round number of 100, which has held firm since November.
- Current range: 101.19 to 102.53
Further levels in both directions:
- Below: 101.19, 100.00, 99.57 and 98.97
- Above: 102.53, 103.07, 104.17 and 105.70
OANDA's Open Positions Ratio
USD/JPY ratio is little changed in Monday trade. This is not consistent with the movement we're seeing from the pair, as the yen has posted gains to start off the week. The ratio is made up of a large majority of long positions, indicating strong trader bias towards the dollar reversing direction and posting gains.
USD/JPY Fundamentals
- 5:00 Japanese Leading Indicators. Estimate 106.0%. Actual 105.7%.
- 23:50 Japanese Current Account. Estimate 0.17T.
*Key releases are highlighted in bold
*All release times are GMT
