GROWTHACES.COM Trading Positions:
- AUD/USD: long at 0.9305, target 0.9470, stop-loss 0.9230
- USD/CAD: long at 1.0850, target 1.1000, stop-loss 1.0810

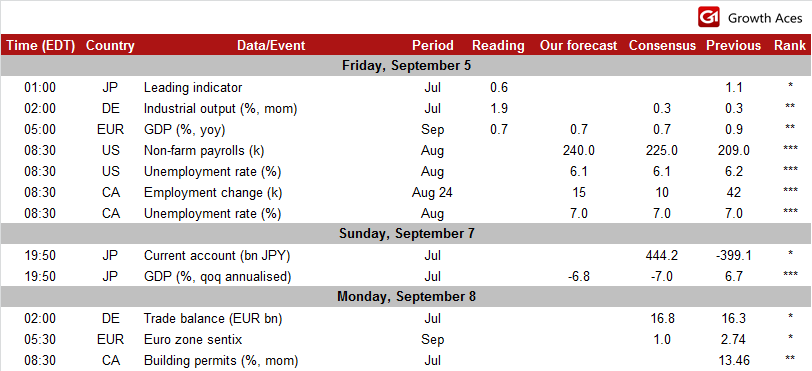
USD/JPY: Japan's leading indicator suggests economic recovery.
- Japanese Economics Minister Akira Amari said there is nothing surprising about the dollar's rise to a six-year high versus the yen. Amari said he would expect the government and the Bank of Japan to work together to support the economy if there was uncertainty about the outlook. Amari said the government is ready to roll out a stimulus package to limit the economic impact if it decides to raise the sales tax next year.
- Japanese Finance Minister Taro Aso said that rapid FX moves were undesirable. He added he shared the central bank chief's concern about the risks of forgoing a planned sales tax hike next year given the country's dire public finances. He was referring to Bank of Japan Governor Haruhiko Kuroda's remark the previous day that the government and central bank would not be able to respond to such risks in the event that Japan's debt management loses market confidence.
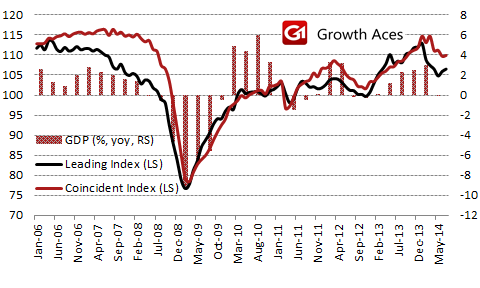
- Japan's index of coincident economic indicators rose a preliminary 0.2 point in July from the previous month. The index of leading economic indicators rose 0.6 point from June. Let’s take a look at the chart. We see that leading indicator is a gauge of the economy a few month ahead. It falls earlier and faster than coincidence indicator ahead of economic slowdown (in this case the coincidence indicator is often above the leading indicator) and rises earlier and faster ahead of economic recovery (in this case the coincidence indicator is often below the leading indicator). In line with today’s reading the coincidence indicator is above the leading indicator but the difference has narrowed. This means that the economy is in the downturn phase, but we could expect positive tendencies for GDP growth in the next quarters.

- On the other hand, a recent run of weak data, including a slump in household spending and slow output growth in July, has cast doubt on the forecast that the economy will rebound steadily in the current quarter to sustain a moderate recovery. The pace of growth from July will be crucial to Prime Minister Shinzo Abe's decision, expected by year-end, on whether to proceed with a scheduled second increase in the sales tax to 10%.
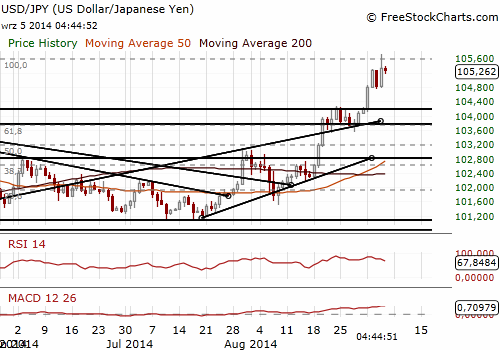
- The USD/JPY touched a near six-year high of 105.71 before comments from Aso that rapid moves of the JPY rate were undesirable and profit-taking ahead of the US Non-Farm Payrolls report pushed it down. An important support is at 104.88 pivot point. We have raised our bid to 104.90 to get long on the next dip.
- In the opinion of GrowthAces.com the USD/JPY will remain on its path to the upside. The one reason is the strength of the USD and the second reason is increased likelihood of additional QE measures by the BOJ after weak macroeconomic releases in Japan. The central bank shifts gradually towards dovishness in its statements following monetary policy decisions since the beginning of this year. In August the BOJ acknowledged the recent weakness in exports and industrial production and in September it referred to the decline in housing investment.

Significant technical analysis' levels:
Resistance: 105.71 (high Sep 5),106.00 (psychological level), 106.15 (high Oct 3, 2008)
Support: 105.00 (psychological level), 104.75 (low Sep 4), 104.72 (low Sep 3)
EUR/USD: All eyes on US Non-Farm Payrolls data today.
- German industrial output rose in July by 1.9% mom, much more than the market consensus of 0.3% mom. The data for June was revised up to a gain of 0.4% mom from a previously reported increase of 0.3% mom.
- ECB Governing Council member Ewald Nowotny said that the central bank cut interest rates in part to help weaken the euro. He added that the EUR/USD rate around 1.30 or slightly lower was "going in the right direction”.
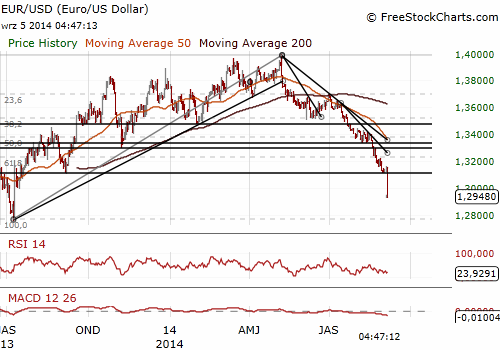
- The EUR/USD struggled to regain a footing on Friday after suffering its biggest daily fall in almost three years on the back of a surprise rate cut in the euro zone. The main event today is the release of Non-Farm Payrolls data. Should the reading beat estimate another sharp EUR/USD down move is likely.
- In the opinion of GrowthAces.com once currency markets have digested the latest ECB moves, the EUR/USD may resume a positive trend in the medium term. We do not assume a scenario of another big sell-off but current momentum and sentiment pose downside risks to this currency pair.

Significant technical analysis' levels:
Resistance: 1.2994 (hourly low Sep 4), 1.3030 (recovery high Sep 4), 1.3110 (low Sep 2)
Support: 1.2920 (low Sep 4), 1.2788 (61.8% of 1.2042-1.3995), 1.2755 (low Jul 9, 2013)
