EUR/USD: Seeking one more low below 1.2834.
With the break below 1.2908 the past week’s minor correction was history and the pair accordingly fell down to a fresh trend low. This time we are however also starting to see a bullish divergence occurring (something that earlier has been a missing piece) indicating that we’ll soon see yet another attempt to kick off an upside correction. The hourly chart wave pattern indicates that we should be seeking at least one more low below 1.2860 before finding terra firma.
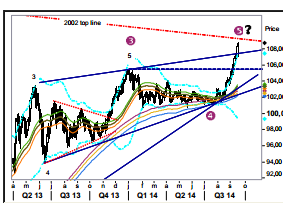
USD/JPY: Heading next for the 2002 top line.
We have now entered a runaway phase, the rather rare event when the market breaks higher (instead of lower) from a rising (ending pattern) wedge. Runaway market targets are hard to pinpoint as they sometimes runs a lot longer than one can imaging but they also have a strong tendency of return lower in the same way as they’re rising i.e. impulsively. There are however two nearby targets to watch, the falling 2002 top line at 109.30 and the theoretical target of the 2013 bull triangle, 109.55.
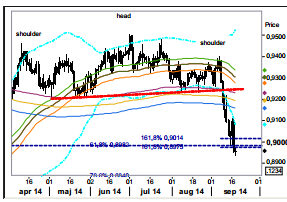
AUD/USD: Enough is enough?
With several short term targets now achieved the risk of another rebound (and especially so as we now, compared to the previous low the other day, are starting to see bullish divergences) might very well be in the making. Making way above the mid body point of yesterday’s falling benchmark candle, 0.9026, will serve as indication that downside momentum is waning.
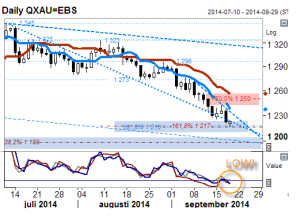
Spot Gold: Below 1,216 would target 1,199 later.
Conditions are severely stretched in this timeframe, but price action is relentlessly offered and in line with trend-following conditions. Violation below a short- & medium-term Fibo combo at 1,217/16 would target a long-term 38.2% Fibo retracement ref at 1,199 later. Dynamic resistance currently exists at 1,237 & 1,256 and should cap any correction together with a weekly mid-body point in between at 1250.