A few years ago, my then-girlfriend (now wife) dragged me to see the movie “Jack and Jill” starring Adam Sandler as Jack…and also as Jill. My expectations were minimal; honestly I would have been happy with just one chuckle. Unfortunately, this abomination of a movie failed to clear even that low hurdle as I sat through one of the worst comedies of all time.
Ahead of today’s US Q1 GDP report, traders had “Jack-and-Jill- level” expectations for US economic growth; even one bright spot amid the anticipated downbeat growth would be enough to reinvigorate USD bulls and heal the rapidly fading hopes of a Fed rate hike before Q4 (for more on today’s upcoming FOMC Statement, see yesterday’s full preview article). Much like the aforementioned nadir of Adam Sandler’s career, the GDP report failed to provide even one morsel for USD bulls.
Against expectations of a 1.0% annualized rise, today’s initial estimate of GDP came out at just 0.2%, down from 2.2% growth at the end of 2014. The details of the report were arguably even worse than the headline reading: Personal Consumption grew at just 1.3%, Capital Expenditures actually fell by 0.4% (worst since the Great Financial Crisis), international trade lopped 1.25% off the GDP reading and the primary source of growth was a big buildup of inventories, which is typically seen as unsustainable. Glass-half-full traders are chalking up the disappointing reading to transitory weather effects, but unless the data improves dramatically in the next month or two, the Fed will likely continue to sit on its hands until September at the earliest.
Technical View: USD/JPY
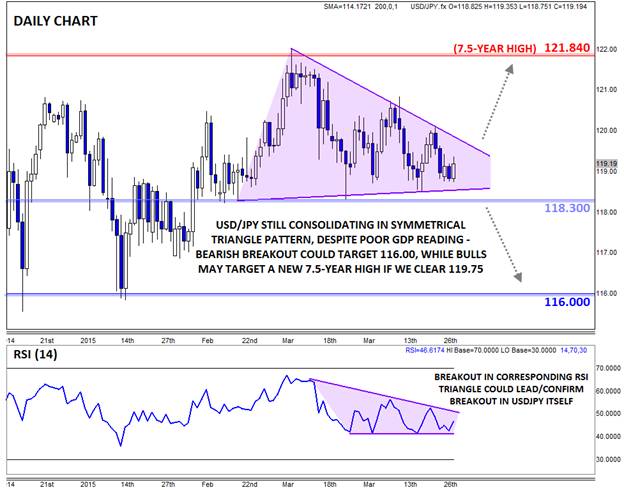
Not surprisingly, the dollar initially fell in response to the disappointing reading, but bargain hunters quickly stepped in to support the greenback, and the buck is actually trading essentially unchanged as of writing. As for USD/JPY, rates peeked below the 119.00 level before bouncing back toward 119.20. From a broader perspective, the pair is consolidating within an increasingly tight 2-month symmetrical triangle pattern.
As a rule, it’s notoriously difficult to predict the direction of a breakout from a symmetrical triangle pattern in advance, but technical oscillators can often provide confirmation of a breakout. In this case, the RSI indicator is carving out its own triangle, so traders should keep an eye on that indicator for a possible leading or confirming signal of a breakout in USD/JPY itself.
From a sentiment perspective, most traders have lost interest in the lackluster trade of USD/JPY, but ironically, that’s generally the time when a pair is most apt to see a breakout. If we see USD/JPY break below support in the 118.30-50 zone, a strong move down toward the six-month low near 116.00 is possible, while a bullish breakout could lead to new 7.5-year highs above 122.00.

