After breaking 100.0 on Monday US trading, with 99.0 tested briefly, price has mostly been in a strong uptrend that allowed USD/JPY to retake 100.0 once more.
Hourly Chart
The 100.0 level happens to be the confluence with the descending trendline when it was breached during early European trading hours, providing more bullish pressure which allowed price to stay above 100.0 despite not being able to test 100.5 fully. Price did retreat back once but the pullback did not manage to inflict any significant damage, with price closing back up above 100.0 – underlining the strong bullish pressure in the short-term. Price has since been trading generally flat since the US trading session, with 100.0 continuing to act as a support and 100.5 still a bridge too far for the bulls.
Current hourly setup looking like an Evening Star bearish reversal pattern. However, it is worth noting that the previous evening star that was formed yesterday (3 hours after the initial push above 100.0) did not manage to yield significant headway for the bears. Then again, the previous Evening Star pattern was not as bearish as the current one as the bearish candle to the right of the “star” failed to close below the initial bullish candle on the left. Furthermore, the divergence between Stochastic and price suggest that the bear cycle this time round may be stronger than before, but we will never know for sure whether this “stronger” bear move will be able to break 100.0.
Daily Chart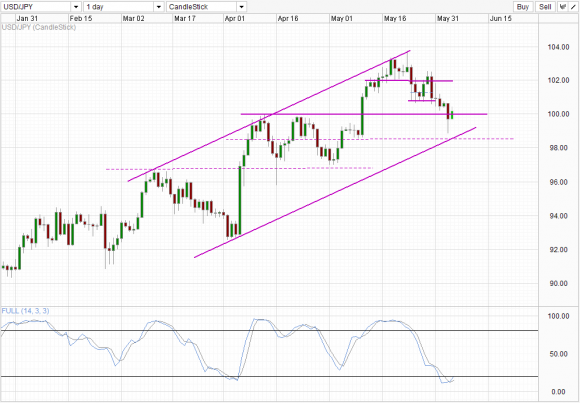 USD/JPY_2" title="USD/JPY_2" width="580" height="403">
Things are the opposite on the daily chart. Stoch readings suggest that a bullish turnaround is possible with readings crossing the Signal line and looking likely to cross the 20.0 mark. If price manage to move higher from here, the strong bullish run will remain fully intact as the dip below 100.0 can be simply disregarded as a mere “fakeout” and has zero detrimental impact on current bullish pressure.
On the USD front, the Greenback has also strengthened slightly yesterday due to the dip in S&P 500 and DJI ( -0.55% and 0.50% respectively). This is important as price has basically failed to test 100.5 despite given a strong fundamental push higher. This lead us to suggest that bears may actually be stronger than we give them credit for. This is in line with the short-term analysis above, but is flying in the face of the bullish pressure depicted via the Daily Chart. Nonetheless, if short-term momentum take hold and push price below 100.0, and preferably below 99.0 and the rising Channel Bottom, the bullish outlook on the Daily Chart can easily switch to a highly bearish one. With NFP coming up on Friday, we could potentially see bears gaining advantage should USD weakens from the news release and that may be the nail in the coffin to alter the longer-term outlook.
- English (UK)
- English (India)
- English (Canada)
- English (Australia)
- English (South Africa)
- English (Philippines)
- English (Nigeria)
- Deutsch
- Español (España)
- Español (México)
- Français
- Italiano
- Nederlands
- Português (Portugal)
- Polski
- Português (Brasil)
- Русский
- Türkçe
- العربية
- Ελληνικά
- Svenska
- Suomi
- עברית
- 日本語
- 한국어
- 简体中文
- 繁體中文
- Bahasa Indonesia
- Bahasa Melayu
- ไทย
- Tiếng Việt
- हिंदी
USD/JPY: Bulls Above 100.0 Vs Bears Below 100.5
Published 06/05/2013, 03:57 AM
Updated 07/09/2023, 06:31 AM
USD/JPY: Bulls Above 100.0 Vs Bears Below 100.5
Latest comments
Loading next article…
Install Our App
Risk Disclosure: Trading in financial instruments and/or cryptocurrencies involves high risks including the risk of losing some, or all, of your investment amount, and may not be suitable for all investors. Prices of cryptocurrencies are extremely volatile and may be affected by external factors such as financial, regulatory or political events. Trading on margin increases the financial risks.
Before deciding to trade in financial instrument or cryptocurrencies you should be fully informed of the risks and costs associated with trading the financial markets, carefully consider your investment objectives, level of experience, and risk appetite, and seek professional advice where needed.
Fusion Media would like to remind you that the data contained in this website is not necessarily real-time nor accurate. The data and prices on the website are not necessarily provided by any market or exchange, but may be provided by market makers, and so prices may not be accurate and may differ from the actual price at any given market, meaning prices are indicative and not appropriate for trading purposes. Fusion Media and any provider of the data contained in this website will not accept liability for any loss or damage as a result of your trading, or your reliance on the information contained within this website.
It is prohibited to use, store, reproduce, display, modify, transmit or distribute the data contained in this website without the explicit prior written permission of Fusion Media and/or the data provider. All intellectual property rights are reserved by the providers and/or the exchange providing the data contained in this website.
Fusion Media may be compensated by the advertisers that appear on the website, based on your interaction with the advertisements or advertisers.
© 2007-2024 - Fusion Media Limited. All Rights Reserved.