Get 40% Off
🚨 Volatile Markets? Find Hidden Gems for Serious Outperformance
Find Stocks Now

USD/JPY Rise In Final Stage; GBP/USD Gap Fill Underway

Published 09/11/2014, 03:50 AM
Updated 07/09/2023, 06:31 AM

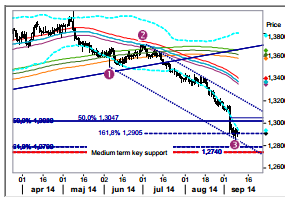
EUR/USD: Still a fair chance wave 3 completed. T

The past three days price action has created a possible V-shaped bottom which together with 1) the arrival at the ideal target, 1.2905, for wave 3 and 2) Tuesday’s piercing pattern candle makes up for a possible base for a forthcoming wave 4 correction/consolidation. The hourly pattern is a bit messy this morning but we think buying a break above 1.2934 will be the way to play it. 

EUR/USD Daily Chart

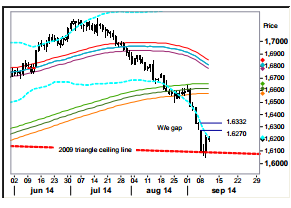
GBP/USD: Gap fill underway.

After a couple of days struggling with the former triangle ceiling (now acting firm support) the market yesterday printed a bullish key day reversal confirming that the sought weekend gap fill of the 1.6332 – 1.6270 gap now is underway (as elaborated on Monday a gap this late in a down phase cannot be a breakaway gap hence it must be a continuation gap and those should always be filled). So short term more strength.

GBP/USD Daily Chart

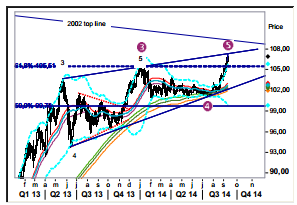
USD/JPY: Rise in its terminal stage.

The adjusted wave count (that was necessary breaking above 105.45) calls for the market to end the rising wedge/circled wave 5 at 107.37 (target rises with approximately one pip a day). Given being probably the most crowded trade it will probably be wise to take some money off the table at any sign of weakness.

USD/JPY Daily Chart

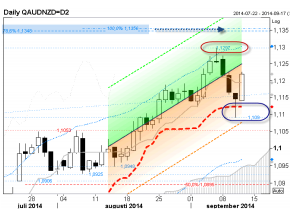
AUD/NZD: Buyers responded at dynamic support.

The Fibo-adjusted 21day "Kijun-Sen" is ascending still but is currently paused, indicating a trending market likely to move back to its equilibrium – and so it did. A bullish candle today/sustained violation of local resistance at 1.1225 would bring back the recent high of 1.1295 back in focus, but sellers should also get tempted by such opportunity, so a best guess is up-before-down. The nearest key-level on south is placed at 1.1055.

3rd party Ad. Not an offer or recommendation by Investing.com. See disclosure here or remove ads .

AUD/NZD Daily Chart

Original post

Latest comments

Risk Disclosure: Trading in financial instruments and/or cryptocurrencies involves high risks including the risk of losing some, or all, of your investment amount, and may not be suitable for all investors. Prices of cryptocurrencies are extremely volatile and may be affected by external factors such as financial, regulatory or political events. Trading on margin increases the financial risks.
Before deciding to trade in financial instrument or cryptocurrencies you should be fully informed of the risks and costs associated with trading the financial markets, carefully consider your investment objectives, level of experience, and risk appetite, and seek professional advice where needed.
Fusion Media would like to remind you that the data contained in this website is not necessarily real-time nor accurate. The data and prices on the website are not necessarily provided by any market or exchange, but may be provided by market makers, and so prices may not be accurate and may differ from the actual price at any given market, meaning prices are indicative and not appropriate for trading purposes. Fusion Media and any provider of the data contained in this website will not accept liability for any loss or damage as a result of your trading, or your reliance on the information contained within this website.
It is prohibited to use, store, reproduce, display, modify, transmit or distribute the data contained in this website without the explicit prior written permission of Fusion Media and/or the data provider. All intellectual property rights are reserved by the providers and/or the exchange providing the data contained in this website.
Fusion Media may be compensated by the advertisers that appear on the website, based on your interaction with the advertisements or advertisers.
© 2007-2024 - Fusion Media Limited. All Rights Reserved.