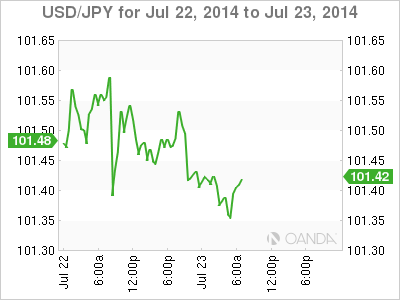
The USD/JPY continues to have an uneventful week, as the pair continues to trade in the mid-101 range on Wednesday. On the release front, it's a quiet day, with just two events on the schedule. In the US, the sole event is Crude Oil Inventories. Japan will release Trade Balance, with the trade deficit expected to widen in the June release.
US numbers were a mix on Tuesday. Inflation numbers continue to struggle, as Core CPI posted a paltry gain of 0.1%, shy of the estimate of 0.2%. The key index has looked anemic in 2014, with its highest gain this year at just 0.3%. CPI was bit stronger, as it gained 0.3% last month, matching the forecast. Meanwhile, Existing Home Sales jumped to 5.04 million, surpassing the estimate of 4.94 million. This was the best showing we've seen since October, and follows a disappointing release from Housing Starts, which was published last week.
Geopolitical tensions are bad news for the markets, which crave stability. With violence continuing in Ukraine and Gaza, nervous investors continue to eye the safe-haven US dollar, so the yen could see some pressure. In Ukraine, the downing of a Malaysian Airlines jet, apparently by pro-Russian separatists, has seriously frayed relations between the West and Russia, which have already been strained since the latter annexed Crimea. Fighting continues between the separatists and Ukrainian forces in Eastern Ukraine. The Europeans are threatening stronger sanctions against Russia, and escalating tensions in eastern Ukraine could shake up the markets. In the Middle East, the fighting in Gaza between Hamas and Israel has intensified, as Israel presses on with a land offensive and casualties rise on both sides. Meanwhile, the international community is intensifying efforts to broker a cease-fire, but in the meantime the fighting continues.

USD/JPY July 23 at 11:40 GMT
USD/JPY 101.42 H: 101.54 L: 101.31
USD/JPY Technical
| S3 | S2 | S1 | R1 | R2 | R3 |
| 99.57 | 100.00 | 101.19 | 102.53 | 103.07 | 104.17 |
- USD/JPY has not showed much activity in the Asian or European sessions, as the pair stays close to 101.40.
- 102.53 is a strong resistance line.
- 101.19 remains an immediate support line. There is stronger support at the round number of 100, which has held firm since November.
- Current range: 101.19 to 102.53
Further levels in both directions:
- Below: 101.19, 100.00, 99.57 and 98.97
- Above: 102.53, 103.07, 104.17 and 105.70
OANDA's Open Positions Ratio
USD/JPY ratio is pointing to gains in short positions on Wednesday. This is consistent with the movement of the pair, as the yen has posted small gains. The ratio is made up of a large majority of long positions, indicating strong trader bias towards the dollar breaking out and moving to higher ground.
USD/JPY Fundamentals
- 14:30 US Crude Oil Inventories. Estimate -2.1M.
- 23:50 Japanese Trade Balance. Estimate -1.11B
