Get 40% Off
🤯 Perficient is up a mind-blowing 53%. Our ProPicks AI saw the buying opportunity in March.Read full update

USD Index: Bullish Momentum Continues

Published 12/29/2014, 07:30 AM
Updated 07/09/2023, 06:31 AM

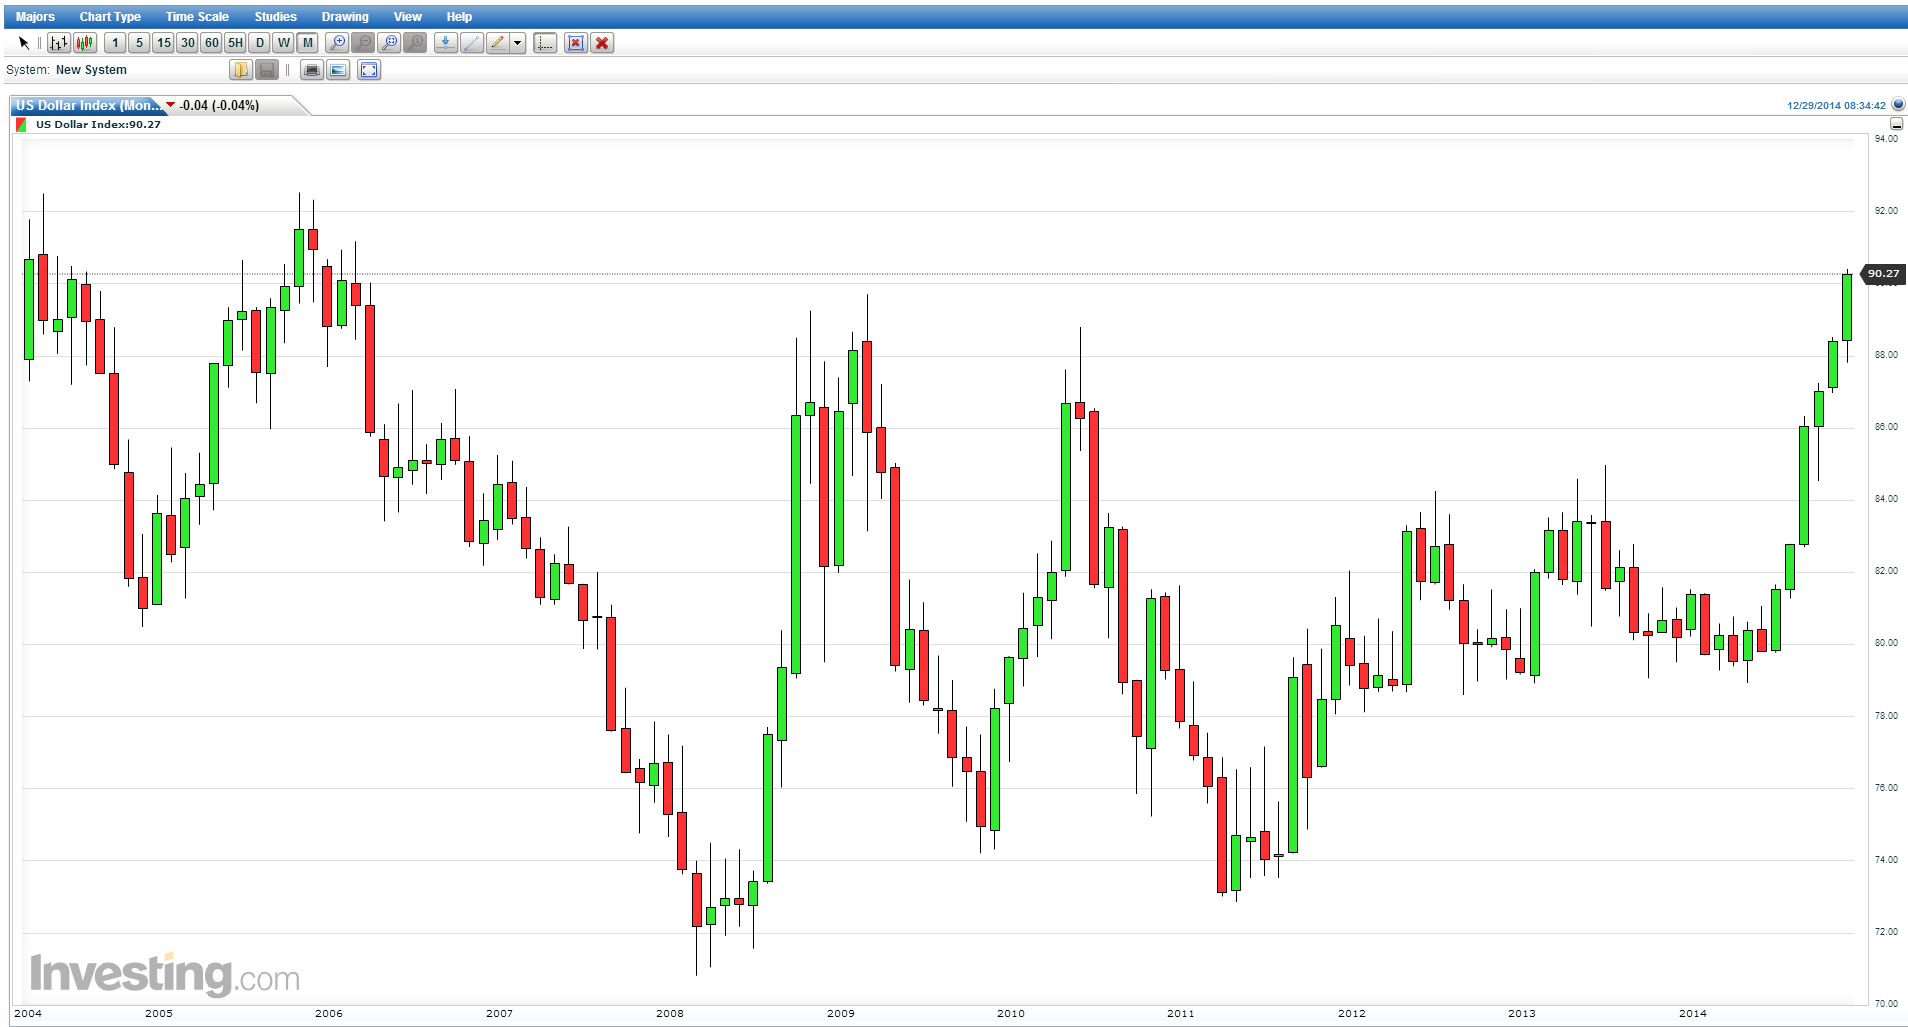
US Dollar Index Monthly Chart From 2004-To Present

For the US dollar, 2014 was most definitely a game of two halves, with the first seeing the currency meander in a tight range as it built a platform of price support in the 79 region, before finally exploding into life in the second half of the year, aided by helpful rhetoric from the FED, a scenario we are likely to see roll forward into 2015.

From a technical standpoint, these two phases of price action could not be more diametrically opposed, with the early part of 2014 suggesting possible further weakness had the floor of price support in the 79 region been breached. However, this price level duly held, and indeed provided the springboard for the USD to break higher on the back of six months of solid gains, as the index trades (at time of writing) at 90.27. This dramatic move has taken the USD index over 10 points since the lows of the first half of 2014. During this bullish price action several key price points have been taken out, the first being the move through the resistance region in the 84.50 area, and more recently the 89.71 high of early 2009.

With this platform of strong price support now in place, the US dollar index looks set to rise further, with the next level of resistance now clearly defined in the 92.50 area, a region tested both in 2004 and again in 2006. Should this be breached in early 2015, this is likely to cement the strong technical picture for the US dollar, and with the FED continuing to signal a recovery and the prospect of rising rates, this will simply add further momentum to the current bullish picture. Whilst 100 is long way off, it would be no surprise to see this level approached towards the end of the next year.

3rd party Ad. Not an offer or recommendation by Investing.com. See disclosure here or remove ads .

Latest comments

Risk Disclosure: Trading in financial instruments and/or cryptocurrencies involves high risks including the risk of losing some, or all, of your investment amount, and may not be suitable for all investors. Prices of cryptocurrencies are extremely volatile and may be affected by external factors such as financial, regulatory or political events. Trading on margin increases the financial risks.
Before deciding to trade in financial instrument or cryptocurrencies you should be fully informed of the risks and costs associated with trading the financial markets, carefully consider your investment objectives, level of experience, and risk appetite, and seek professional advice where needed.
Fusion Media would like to remind you that the data contained in this website is not necessarily real-time nor accurate. The data and prices on the website are not necessarily provided by any market or exchange, but may be provided by market makers, and so prices may not be accurate and may differ from the actual price at any given market, meaning prices are indicative and not appropriate for trading purposes. Fusion Media and any provider of the data contained in this website will not accept liability for any loss or damage as a result of your trading, or your reliance on the information contained within this website.
It is prohibited to use, store, reproduce, display, modify, transmit or distribute the data contained in this website without the explicit prior written permission of Fusion Media and/or the data provider. All intellectual property rights are reserved by the providers and/or the exchange providing the data contained in this website.
Fusion Media may be compensated by the advertisers that appear on the website, based on your interaction with the advertisements or advertisers.
© 2007-2024 - Fusion Media Limited. All Rights Reserved.