The bullish open in equities this week is a reflection of a market that still aims to be a bullish risk as the WSJ reports that the US and China are closer to a deal. It's precisely this 2019 overarching theme that keeps providing support to US yields and the USD as a result. The Euro remains stubborn, as does the Sterling. The Aussie and the Kiwi have not gathered much attention as of late but that's about to change with the RBA policy meeting tomorrow. The CAD and the JPY are the two most fragile currencies, but for different reasons, the former battered by poor data while the Yen acts as the perfect funding currency in an environment of low vol and risk appetite.
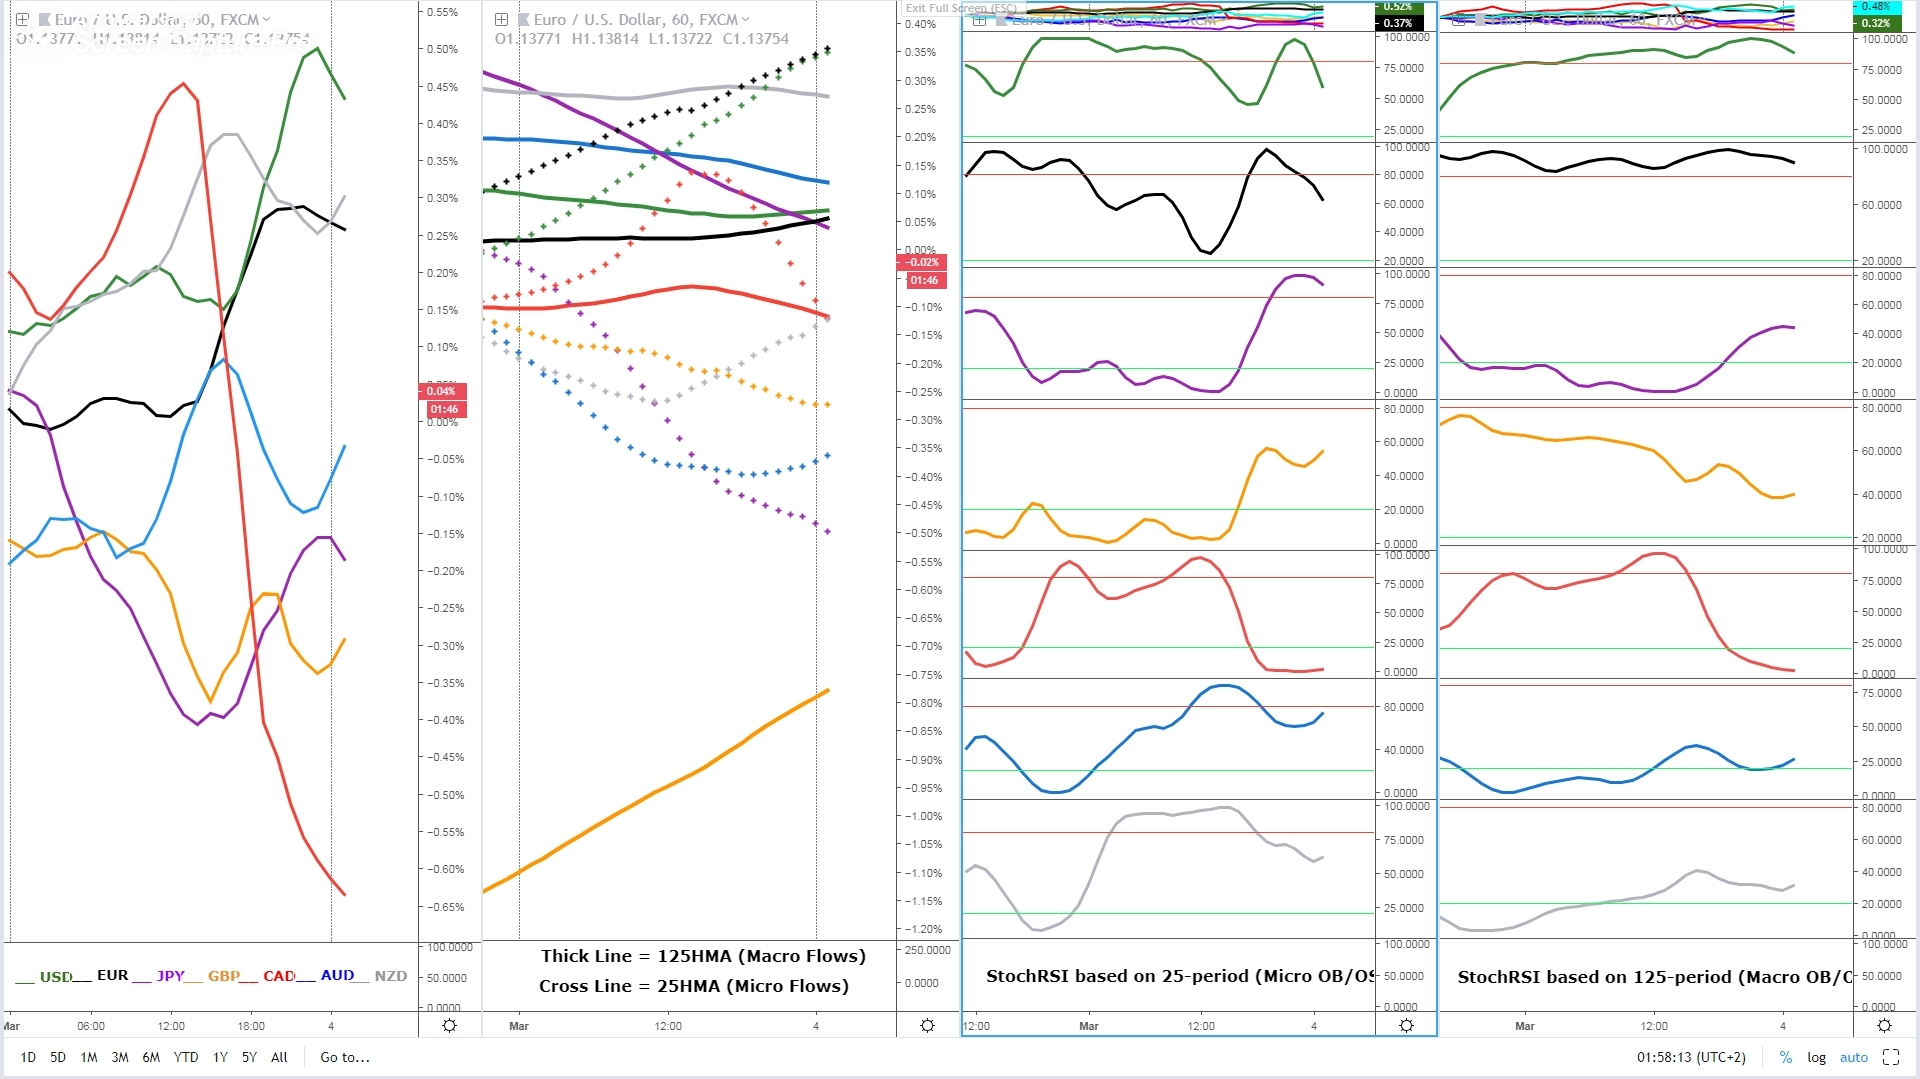
In the last 24h, the USD is ruling the roost in the FX arena, while the Canadian Dollar is by far the most unloved currency after a notable Canadian Q4 GDP miss. The Japanese Yen and the Sterling traded on the weak side during the last trading day as well, but far from the sharp losses seen in the CAD. The recent pockets of EUR demand continue to come in, keeping the currency broadly supported, while the Aussie and the Kiwi also managed to eke out some marginal gains on a daily basis.
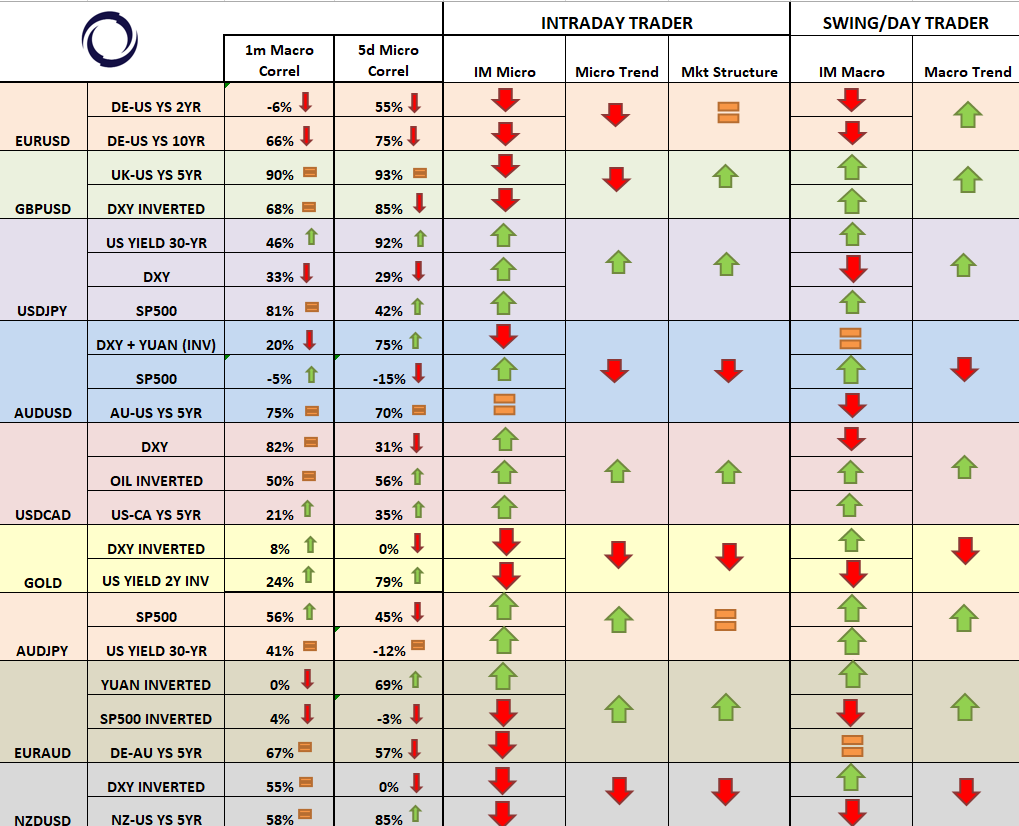
The last 24h of ebbs and flows has resulted in a micro/macro bearish permutation in the Canadian Dollar, which joins the Japanese Yen, the Aussie and to a lesser extend the Kiwi in the macro bar trends as per the 5-DMA slopes in the indices (2nd chart). On the opposite side of the equation, we still find the macro outlook dominated by a bullish GBP, followed by the EUR, while the USD has finally reverted back to macro bullish when cross-checking its performance against its 7 peers.
From a micro standpoint, only the EUR and the USD see concurrence in daily (micro) and weekly trends (macro), although it looks like the Pound is soon going to be a re-alignment again. The Japanese Yen due to ‘risk on’ conditions alongside the Canadian Dollar on negative fundamentals are the only market with the micro and macro in agreement, this time to the bearish side.
Narratives In Financial Markets
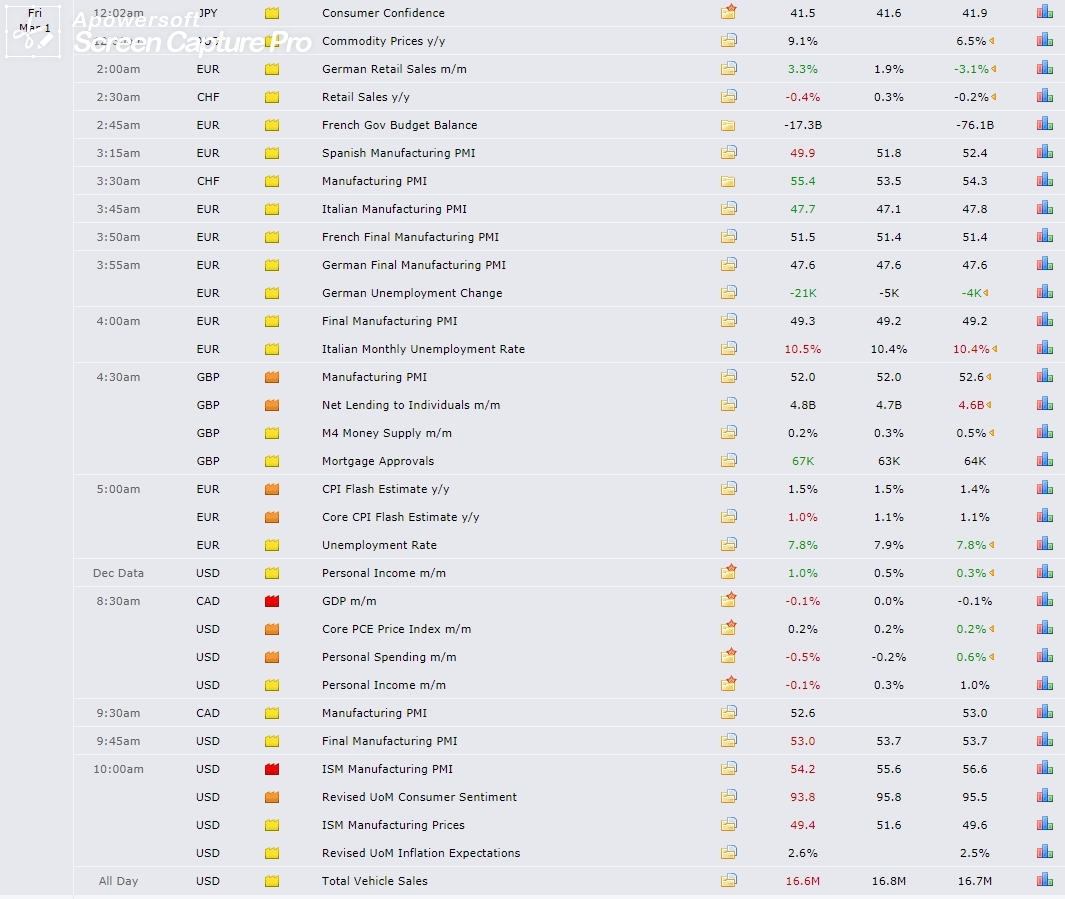
- Markets shrug off poor US data (consumer confidence, ISM) as the USD keeps pressing higher in line with the rampant movements seen in UST yields.
- CAD is the main laggard after a major miss on Friday’s Canadian Q4 GDP figures. The stats were released by mistake over 25m ahead of schedule, causing an early collapse in CAD value.
- The WSJ is out with a weekend report about the US and China being in the final stages of completing a trade deal. The people cited do caution hurdles still ahead. A deal will only be formalized upon a summit between the US and Chinese President in mid-late March.
- In other weekend news, US President Trump has asked China to immediately remove all tariffs on US agricultural products in return of postponing the March tariffs hike deadline.
- Also over the weekend, US President Trump kept criticizing the Fed for hiking rates and promoting a strong USD, both factors hurting the economy, he said.
- The Pound begins a new week on a stronger note after weekend news that Conservative Brexiteers are softening their stance to support UK’s PM May to leave the EU. As of late, the GBP has been on a tear on the basis of a favorable Brexit outcome, be it a delay of the Brexit deadline by extending Article 50 or even the celebration of a 2nd referendum down the road.
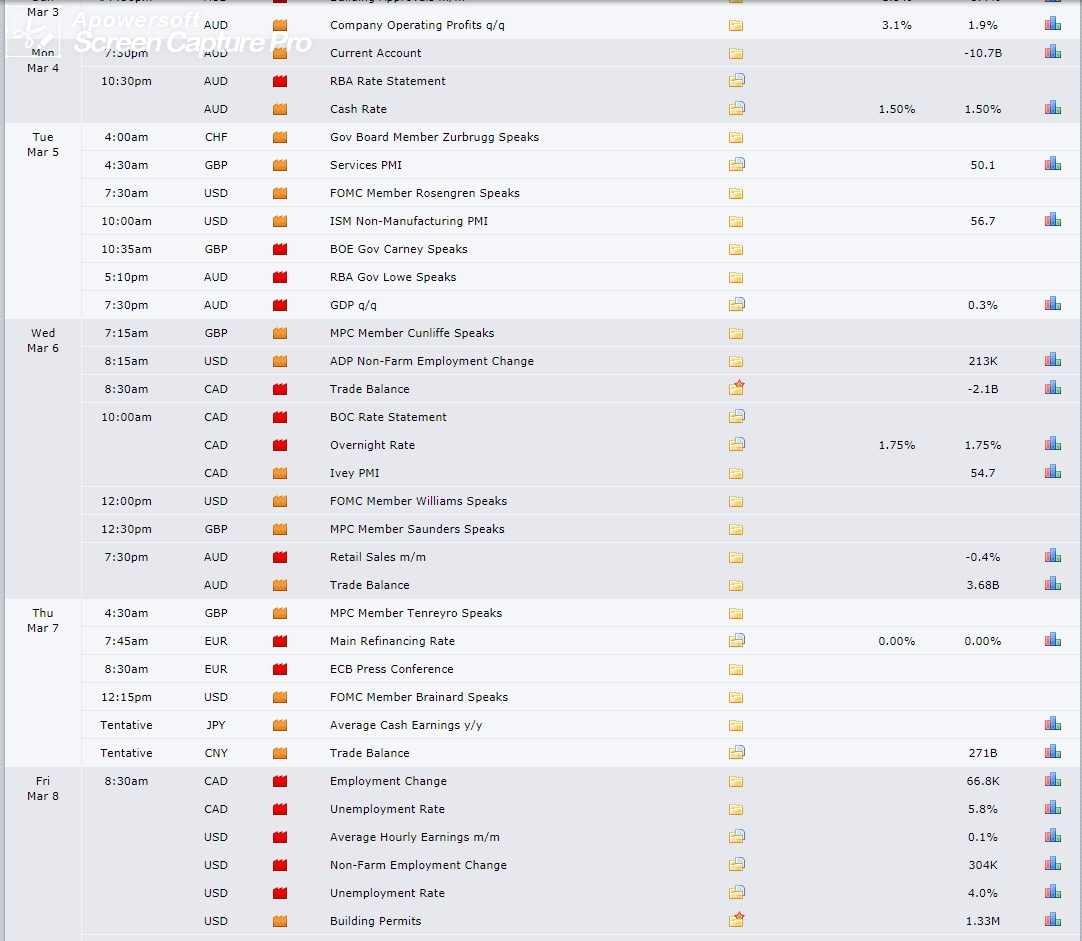
- A long list of important economic news lined up to simulate flows this week, including Australia’s RBA policy meeting, Australia’s GDP, BoC’s policy meeting, US jobs…
Source: Forexfactory
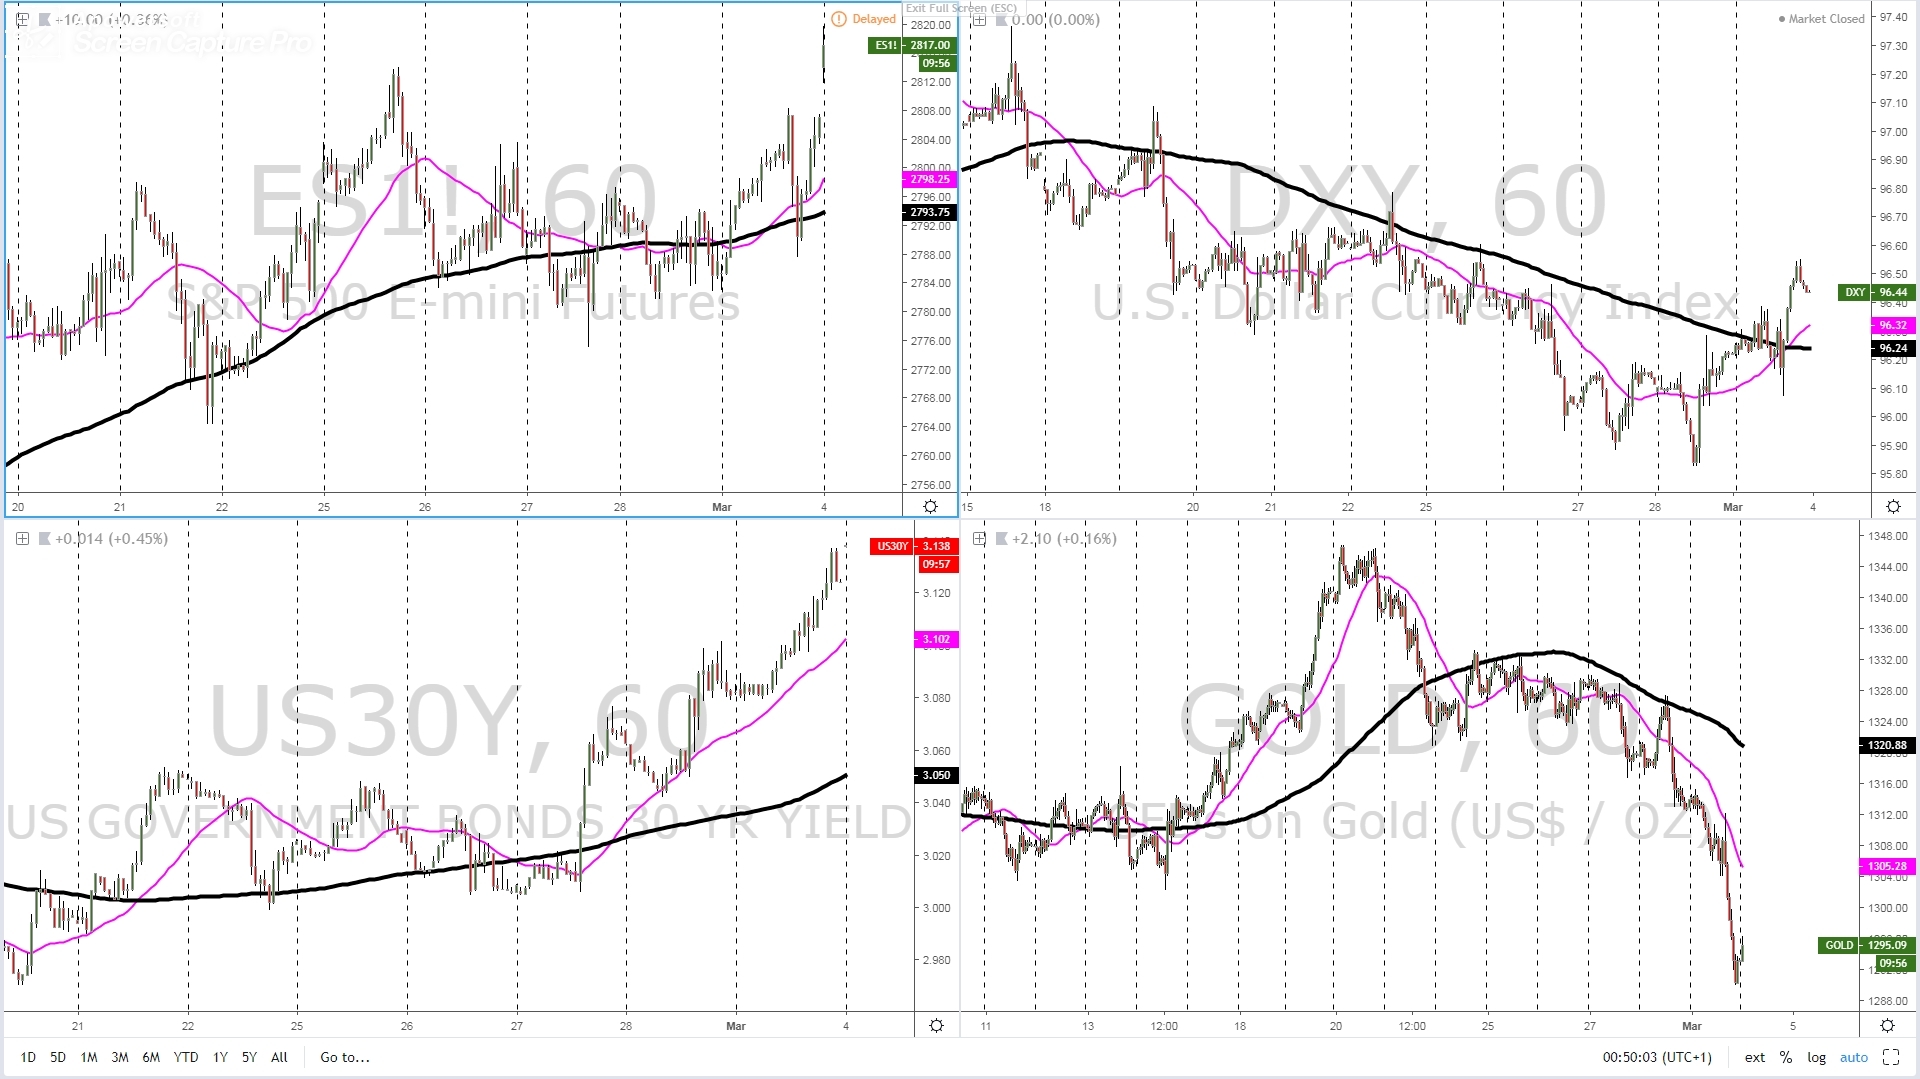
The short-term model indicates an environment where the world’s reserve currency (USD) is in high demand, with the persistent selling of US bonds (higher yields) propelling the momentum. Amid this environment, the SP 500 futures as the bellwether for the global equity market, have gone ballistic at the open of markets in Asia, hence the present dynamics of USD strength must be put into a context of ‘risk on’ as equities rise. The macro outlook only gets better for risk conditions, as the slope of the 5-DMA still qualifies as a ‘true risk on’ scenario, with currencies the likes of the Japanese Yen or other fundamentally weaker (CAD as of late) set to suffer the most. Note, if the USD can extend its gains through Monday, we might finally permute, from a macro standpoint, into an environment characterized by USD strength in a context of risk appetite (scenario #5).
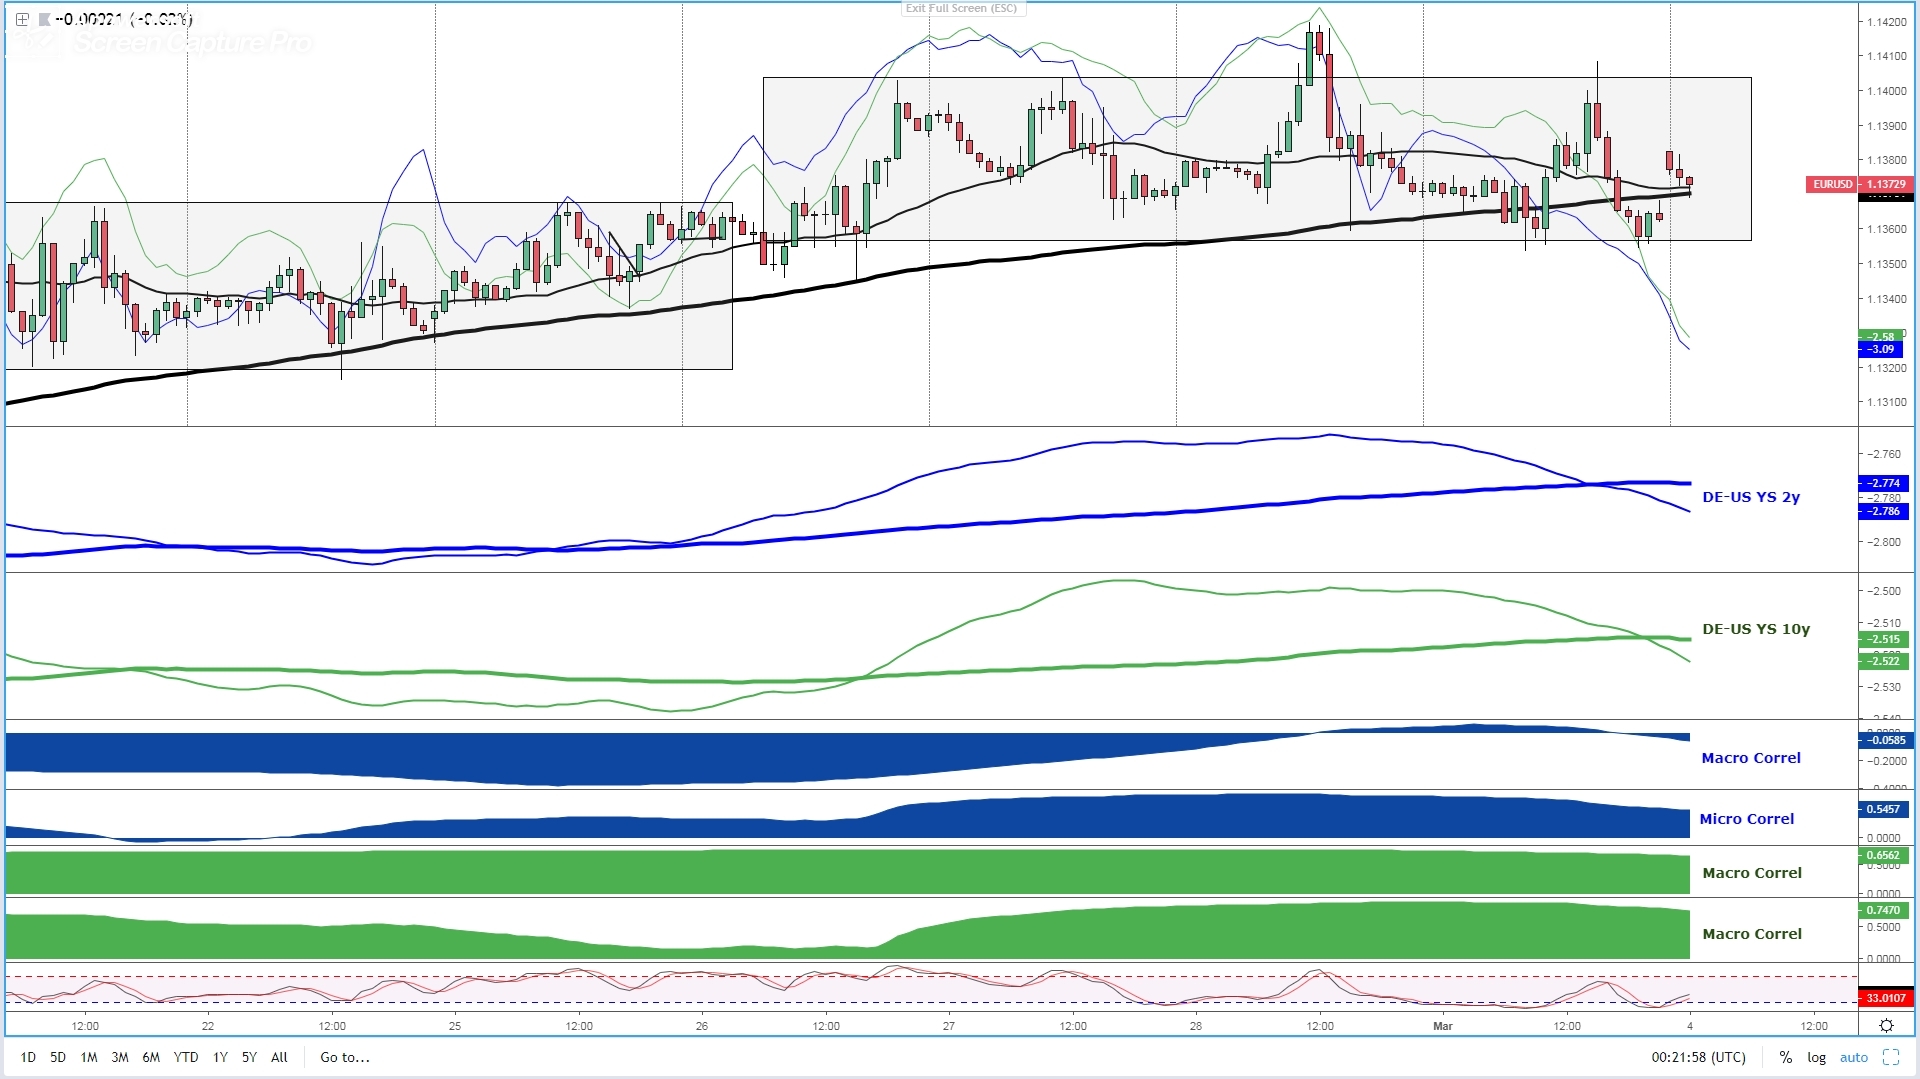
EUR/USD has come under renewed downward pressure even if the overall pockets of demand to amass the single currency in one’s portfolio remains quite solid. Testament of that stubbornness is the lingering range despite the rampant demand for USDs as the microenvironment enters a USD strength period amid soaring US yields, reflected on the collapse of the German-US yield spread. It is because of this sharp downward move in the yield spread that this pair still offer sufficient justification to be a sell on rallies at technically attractive areas. Last Friday, with the 10y yield spread serving as the true guidance of intrinsic value, the retest of 1.14 became a pristine opportunity to look for sell-side opportunities in line with the bearish divergence in the spread.
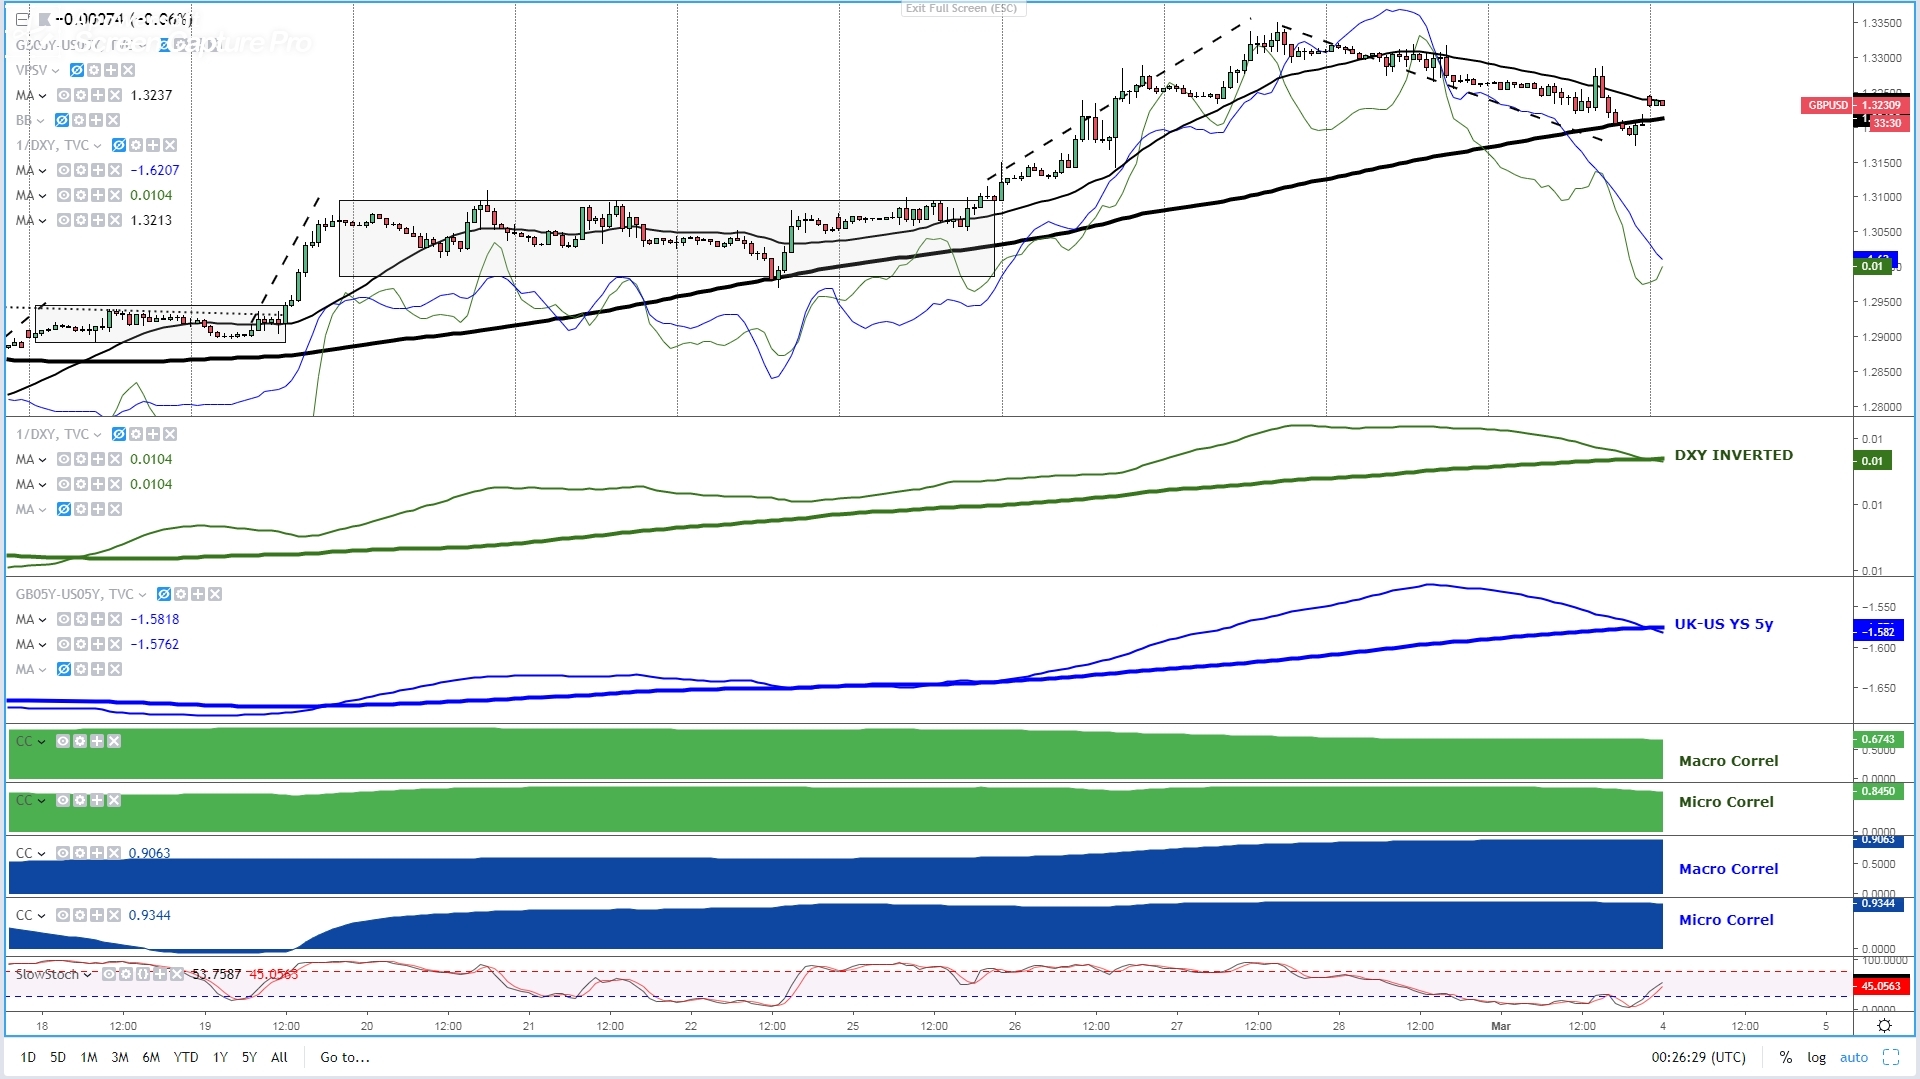
If you are a swing trader looking for opportunities in the currency market, the recent pullback in the Sterling is worth monitoring. The strong bullish trend in US yields doesn’t make the USD the best market to capitalize the potential return of GBP demand, so pay attention to GBP vs AUD, JPY, CAD on the basis of ‘risk on’ conditions (negative JPY) and AUD, CAD (negative fundamentals). With such a powerful movement in the DXY and the UK vs US yield spread, it’s hard to justify much higher levels in GBP/USD at this stage, which is not the case if looking to play GBP longs vs above-mentioned currencies. Remember, the GBP is the market with the strongest macro bullish trend out there, that’s why picking the right timing to engage in a buy-side campaign could yield great opportunities.
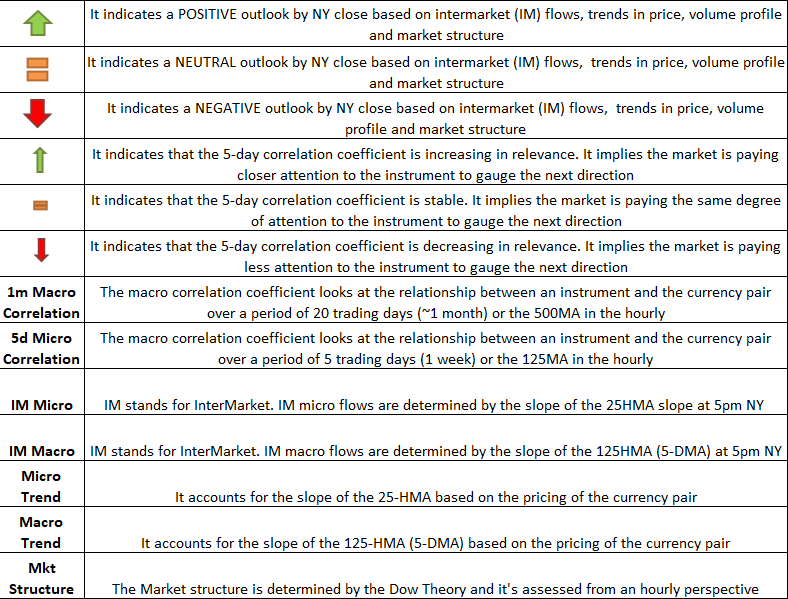
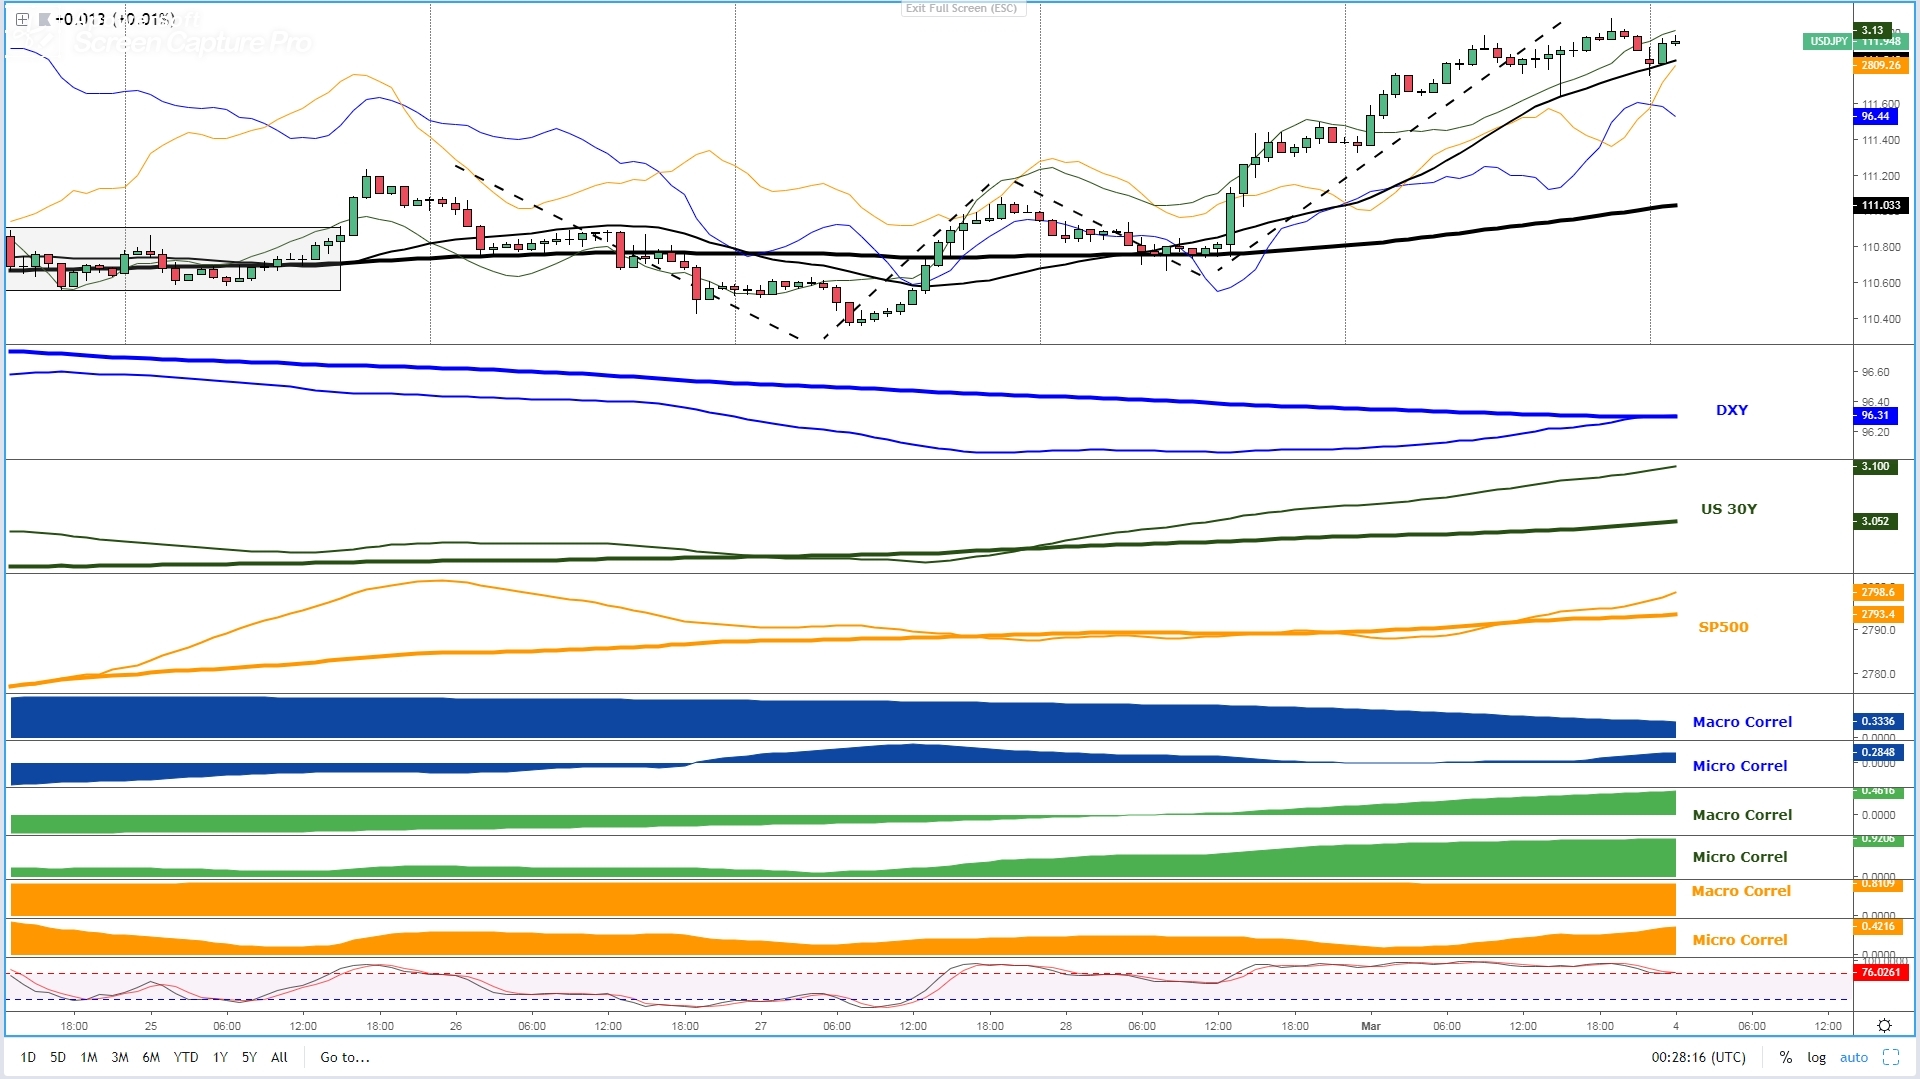
The USD/JPY, as in the case of Gold, are two markets currently experiencing the perfect storm as the DXY rises in tandem with soaring US yields. From an hourly perspective, the market spent the entire Friday trading up through overbought conditions as per the slow stoch readings, which was a scenario able to be achieved due to the consistent sell-off of US bonds (higher yields). We can notice the growing influence that US yields have exerted on the price of the pair as of late, with the micro and macro correlation coefficients rising fast. Finding the appropriate technical levels to engage in ‘buy on dip’ strategies is the base scenario as per the latest technical/intermarket analysis, with the trend, the market structure and the slopes in the micro and macro backing up the trend.
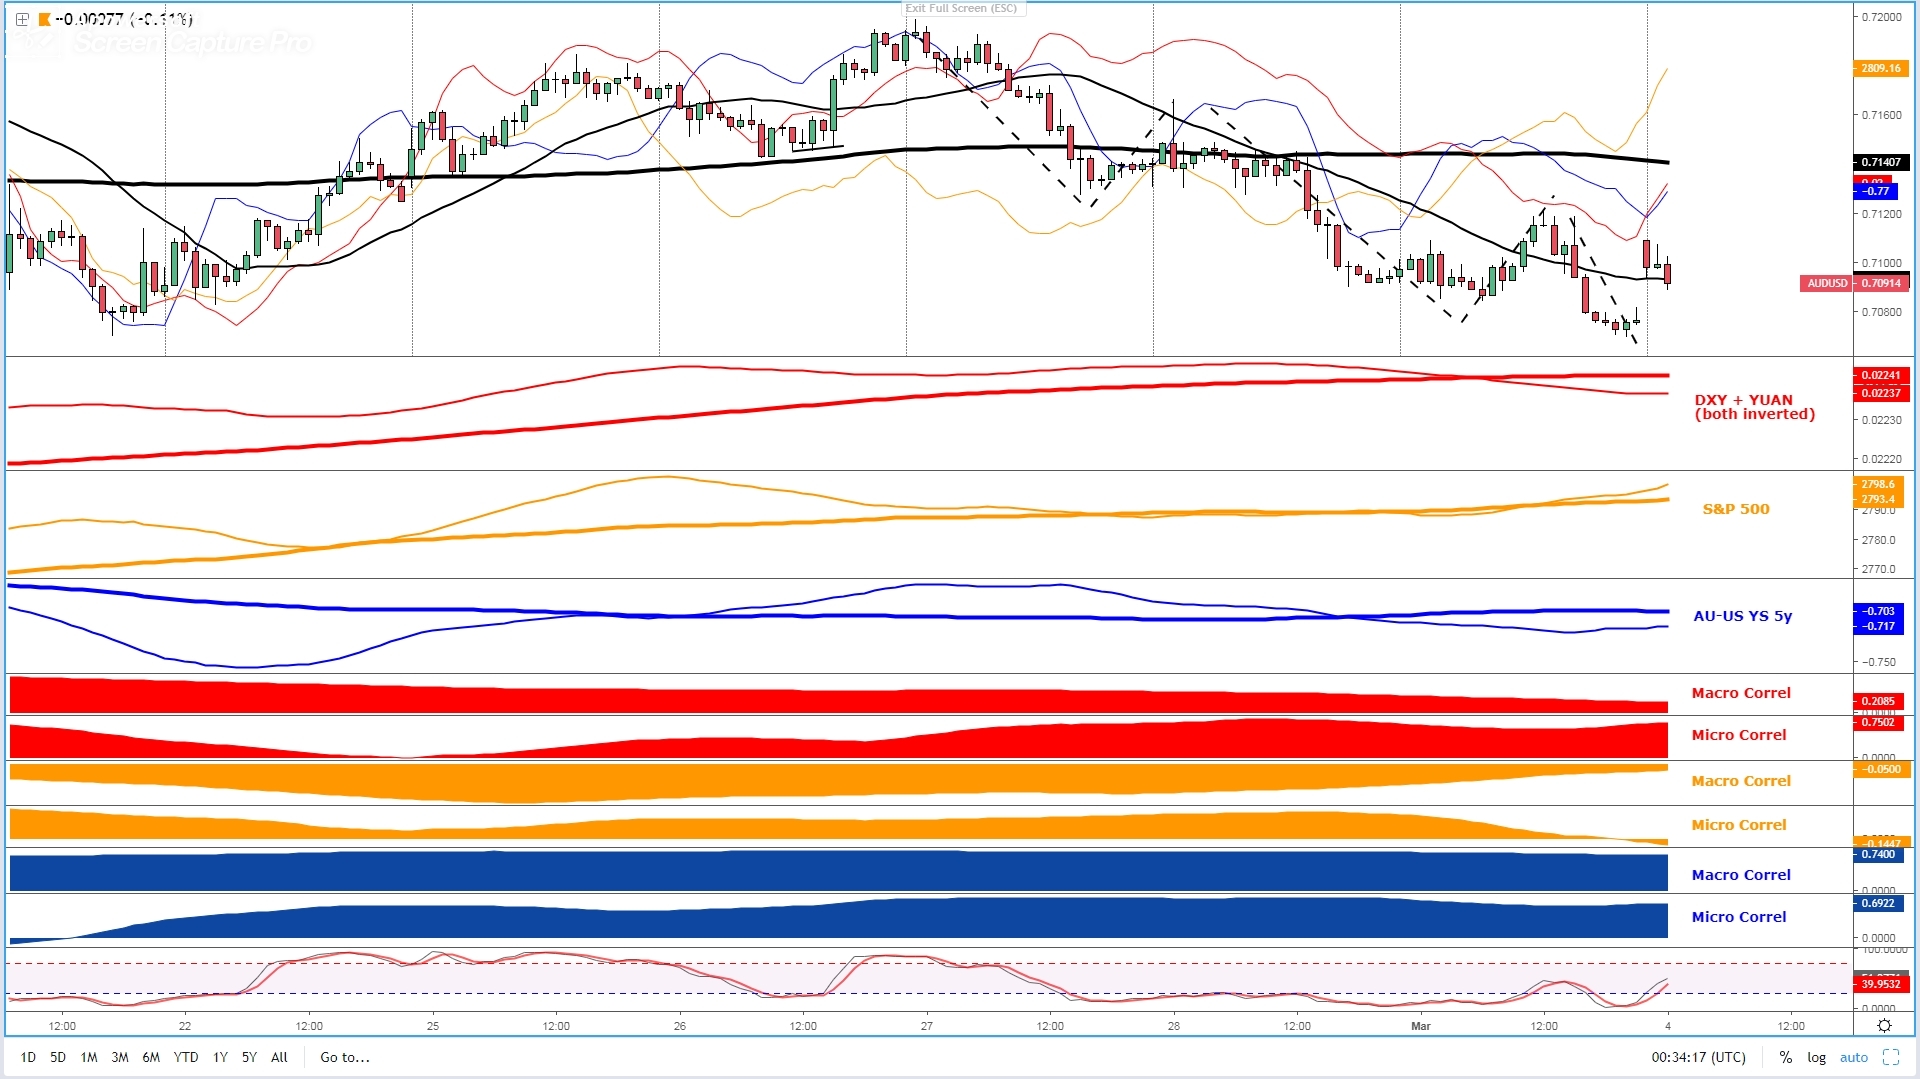
Do note that even if today’s Australian data came downbeat, and the technical picture has deteriorated substantially, the micro slope in correlated asset argues for a rebound in the AUD/USD. The report of the WSJ suggesting further progress in the US/China trade negotiations has been anchoring correlated assets (Yuan, equities…). From a technical perspective, the Aussie is testing the critical support areas at 7050-7060c with the latest push lower failing miserably to extend much beyond the prior low. This is all compounding evidence that makes further downside risks limited. A resumption of the Aus--US yield spread alongside DXY rallying would negate the constructive case.
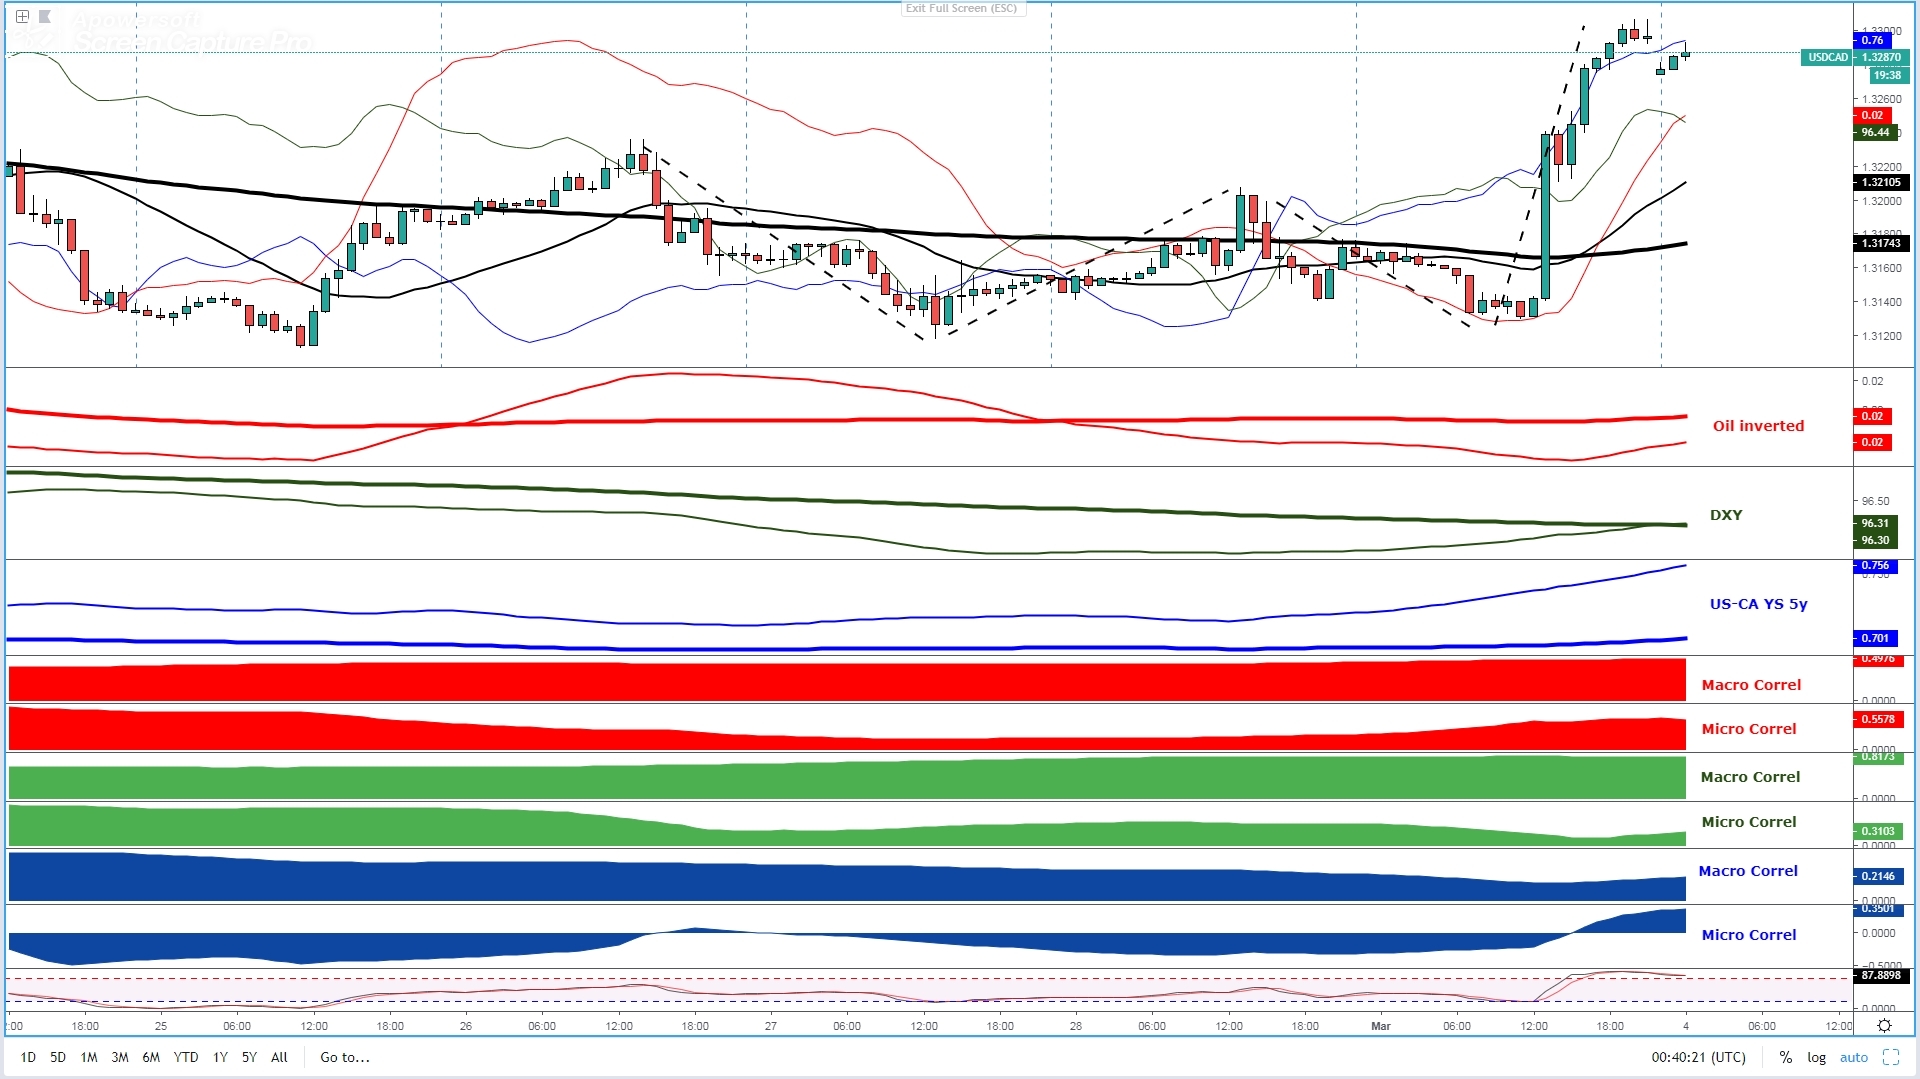
As the table above shows, the extreme demand imbalance in the USD/CAD has resulted in another perfect ‘bullish storm’, which as in the case of the USD/JPY, makes this market a clear ‘buy on weakness’. The overextension in the hourly is clear as per the slow stoch, so be prudent on what areas you pick with the current pricing offering a very poor reward to risk for those swing/day traders, while intraday type accounts and momentum EAs may still find opportunities to capitalize as as long the flows emanating from correlated assets such as the DXY, Oil, yields remain in favor.
Important Footnotes
- Risk model: The fact that financial markets have become so intertwined and dynamic makes it essential to stay constantly in tune with market conditions and adapt to new environments. This prop model will assist you to gauge the context that you are trading so that you can significantly reduce the downside risks. To understand the principles applied in the assessment of this model, refer to the tutorial How to Unpack Risk Sentiment Profiles
- Cycles: Markets evolve in cycles followed by a period of distribution and/or accumulation. The weekly cycles are highlighted in red, blue refers to the daily, while the black lines represent the hourly cycles. To understand the principles applied in the assessment of cycles, refer to the tutorial How To Read Market Structures In Forex
- POC: It refers to the point of control. It represents the areas of most interest by trading volume and should act as walls of bids/offers that may result in price reversals. The volume profile analysis tracks trading activity over a specified time period at specified price levels. The study reveals the constant evolution of the market auction process. If you wish to find out more about the importance of the POC, refer to the tutorial How to Read Volume Profile Structures
- Tick Volume: Price updates activity provides great insights into the actual buy or sell-side commitment to be engaged into a specific directional movement. Studies validate that price updates (tick volume) are highly correlated to actual traded volume, with the correlation being very high, when looking at hourly data. If you wish to find out more about the importance tick volume, refer to the tutorial on Why Is Tick Volume Important To Monitor?
- Horizontal Support/Resistance: Unlike levels of dynamic support or resistance or more subjective measurements such as fibonacci retracements, pivot points, trendlines, or other forms of reactive areas, the horizontal lines of support and resistance are universal concepts used by the majority of market participants. It, therefore, makes the areas the most widely followed and relevant to monitor. The Ultimate Guide To Identify Areas Of High Interest In Any Market
- Trendlines: Besides the horizontal lines, trendlines are helpful as a visual representation of the trend. The trendlines are drawn respecting a series of rules that determine the validation of a new cycle being created. Therefore, these trendline drawn in the chart hinge to a certain interpretation of market structures.
- Correlations: Each forex pair has a series of highly correlated assets to assess valuations. This type of study is called inter-market analysis and it involves scoping out anomalies in the ever-evolving global interconnectivity between equities, bonds, currencies, and commodities. If you would like to understand more about this concept, refer to the tutorial How Divergence In Correlated Assets Can Help You Add An Edge.
- Fundamentals: It’s important to highlight that the daily market outlook provided in this report is subject to the impact of the fundamental news. Any unexpected news may cause the price to behave erratically in the short term.
- Projection Targets: The usefulness of the 100% projection resides in the symmetry and harmonic relationships of market cycles. By drawing a 100% projection, you can anticipate the area in the chart where some type of pause and potential reversals in price is likely to occur, due to 1. The side in control of the cycle takes profits 2. Counter-trend positions are added by contrarian players 3. These are price points where limit orders are set by market-makers. You can find out more by reading the tutorial on The Magical 100% Fibonacci Projection


