June's AI-picked stock updates now live. See what's new in Tech Titans, up 28.5% year to date.Unlock Stocks

USD/CAD Breakout Fails; AUD/USD Reaction Levels Are Higher

Published 03/30/2014, 02:17 AM
Updated 07/09/2023, 06:31 AM
EUR/USD
-
GBP/USD
-
USD/JPY
-
USD/CHF
-
AUD/USD
-
USD/CAD
-
NZD/USD
-
  • EUR/USD 1.3642 and 1.3820/60 are ‘tradable’
  • AUD/USD reaction levels are slightly higher
  • USD/CAD breakout fails; but 1.0985 is support
  • EUR/USD

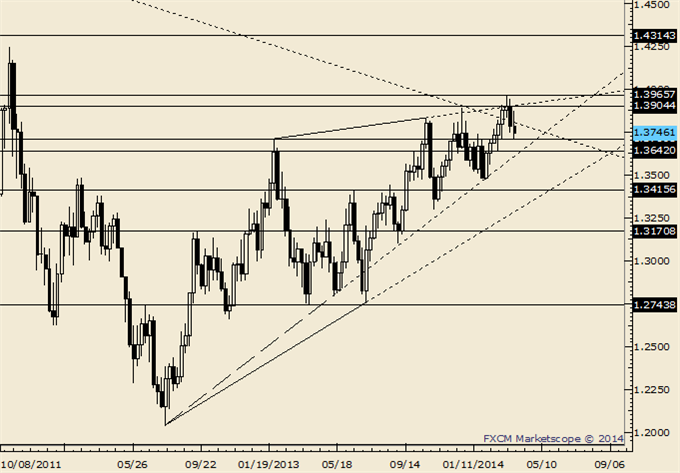
    EUR/USD Weekly Chart

    • EUR/USD failure to hold above the line that extends off of the 2008 and 2011 highs is well documented. As mentioned the last several weeks, “the development could mark an important change in conditions. A reaction area rests at the February 2013 high of 1.3710 and a break below 1.3642 would make a stronger case for a larger topping process.”
    • On Friday, EUR/USD responded to the 3/5 low. Whilst a larger top appears be brewing, respect bounce potential from 1.3642. 1.3813/30 is estimated resistance.

    GBP/USD

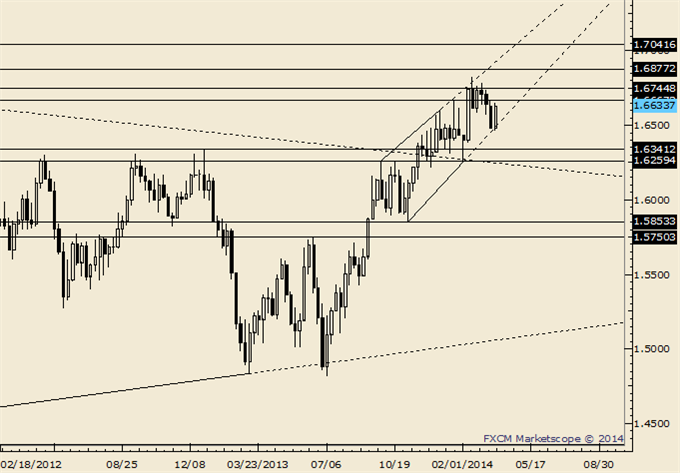
    GBP/USD Weekly Chart

    • A weekly key reversal the week that ended 2/21 and a doji the week that ended 3/7 are warnings of a top. The rate bounced from the line that extends off of the November and February lows, keeping near term upside pressure intact.
    • Given extreme COT readings, don’t forget about the reversal characteristics seen at the February top. One can’t dismiss the trendline hold this week either. Tis a battle between bullish and bearish interests and selling is eyed near 1.6665 and 1.6711 with support at 1.6567 and 1.6495.

    AUD/USD

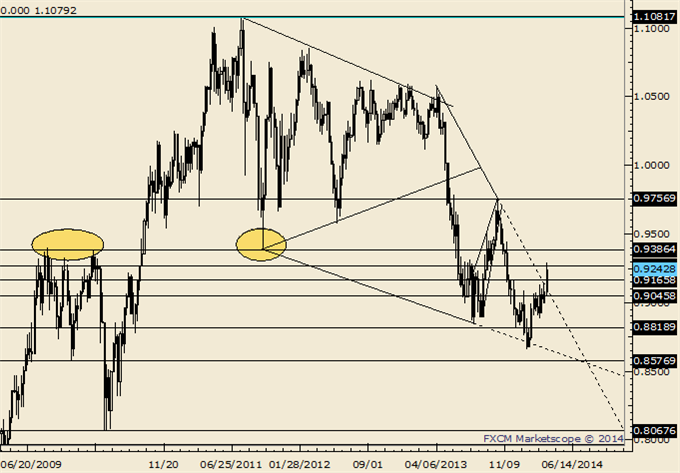
    AUD/USD Weekly Chart

    • The AUD/USD broke out this week. The head and shoulders measured target is .9500/11 but there a good deal of levels before then that could inspire a reaction. The levels in question are .9320s (see June-July levels) and .9386-.9405 (2009 high / 2011 low).
    • .9150/90 is estimated support.

    NZD/USD

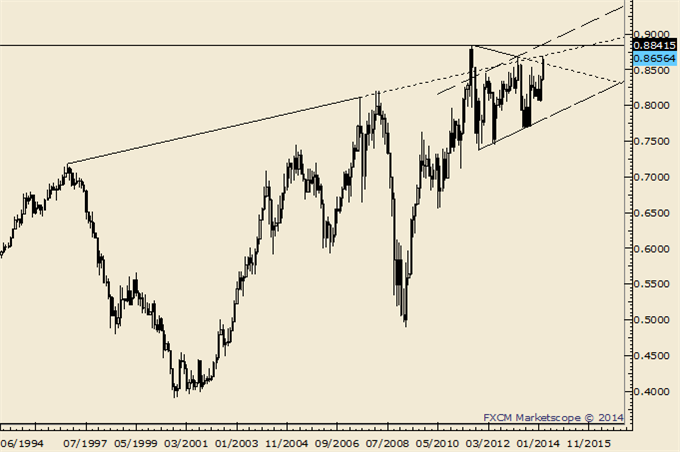
    NZD/USD Weekly Chart


    • The NZD/USD ends March on a high note. The rate tagged the 2013 high this week and is pressing against the line that extends off of the 1996 and 2007 highs. That line crosses through the 2008, 2011, and 2014 highs as well. In 2011 (record free float high), the rate surged through the line in late July before topping on August 1st. Does something similar happen here? The channel that defines the advance from the 2011 low is just above the record high in April.

    USD/JPY

    USD/JPY Weekly Chart

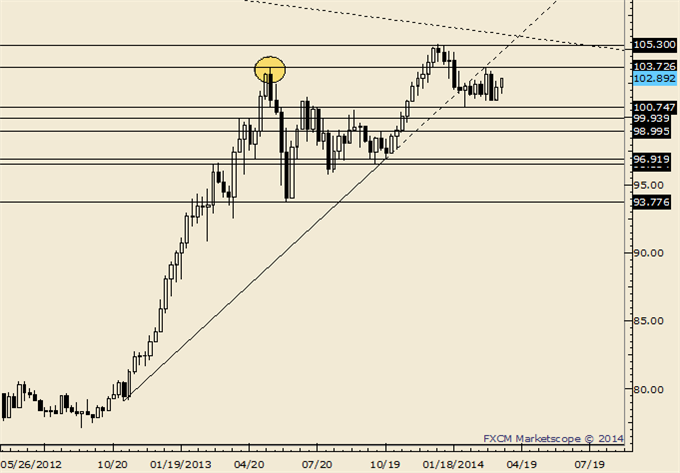
    • The USD/JPY tested the underside of the trendline that connects the lows from November 2012 and October 2013 3 weeks ago. The top was also in line with the May 2013 high.
    • Since February 1, USD/JPY has spent most of its time between 101.50 and 102.75. Prognostications regarding which way the market will break are silly but I will note key levels within the multi month range at 103.25 and 102.17/32.
    • Longer term, the trend is up but there is an Elliott case to be made for a return to the 4thwave of one less degree. The range spans 93.78 to 96.55. That seems drastic

    USD/CAD

    USD/CAD Weekly Chart

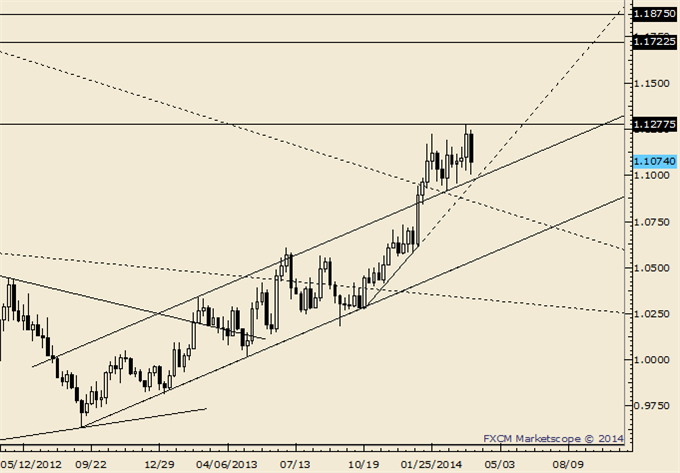
    • Measured objectives from the breakout above the 2011 high range from 1.1680 to 1.1910. The Jul 2009 high rests in this zone at 1.1724 and the 2007 high is near the top of the zone at 1.1875.
    • From an Elliott perspective, it’s possible that the rally from the 2012 low composes a ‘3rd of a 3rd (or C)’ wave from the 2007 low.
    • The close above the line that extends off of the 2002 and 2009 highs as well as the close above corrective channel resistance add credence to the 3rd of a 3rd wave position. Watch for support at 1.0985 next week. Failure to hold 1.0909 would delay the bull and open up 1.0736 (December high).

    USD/CHF

    USD/CHF Weekly Chart

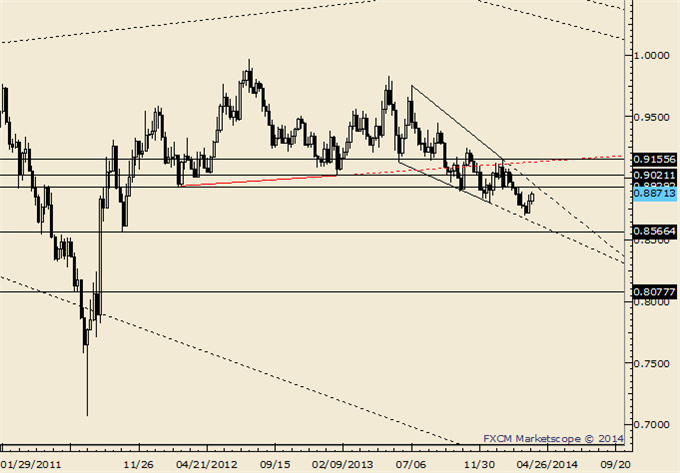
    • The USD/CHF (and EUR/USD for that matter) traded through their early March highs on Friday. The monthly ranges are small but the events qualify as ‘intra-month reversals’ nonetheless (month closes Monday). Some reversals come with a bang and some come with a whimper. Exceeding the line that extends off of the July and January highs would brighten the longer term bull case.

    Original post

Latest comments

Loading next article…
Risk Disclosure: Trading in financial instruments and/or cryptocurrencies involves high risks including the risk of losing some, or all, of your investment amount, and may not be suitable for all investors. Prices of cryptocurrencies are extremely volatile and may be affected by external factors such as financial, regulatory or political events. Trading on margin increases the financial risks.
Before deciding to trade in financial instrument or cryptocurrencies you should be fully informed of the risks and costs associated with trading the financial markets, carefully consider your investment objectives, level of experience, and risk appetite, and seek professional advice where needed.
Fusion Media would like to remind you that the data contained in this website is not necessarily real-time nor accurate. The data and prices on the website are not necessarily provided by any market or exchange, but may be provided by market makers, and so prices may not be accurate and may differ from the actual price at any given market, meaning prices are indicative and not appropriate for trading purposes. Fusion Media and any provider of the data contained in this website will not accept liability for any loss or damage as a result of your trading, or your reliance on the information contained within this website.
It is prohibited to use, store, reproduce, display, modify, transmit or distribute the data contained in this website without the explicit prior written permission of Fusion Media and/or the data provider. All intellectual property rights are reserved by the providers and/or the exchange providing the data contained in this website.
Fusion Media may be compensated by the advertisers that appear on the website, based on your interaction with the advertisements or advertisers.
© 2007-2024 - Fusion Media Limited. All Rights Reserved.