- US dollar tumbles through key support levels, but here are the levels we’re watching next
- The surge in volatility suggests major support/resistance will continue to be broke
The US Dollar has tumbled through significant support versus the euro, Japanese yen and other majors. What levels are worth watching next?
EUR/USD
Total Buy Volume Executed, Total Sell Volume Executed, Net Volume Executed (Buy-Sell)
Length of bar indicates the sum of Buy and Sell volume.
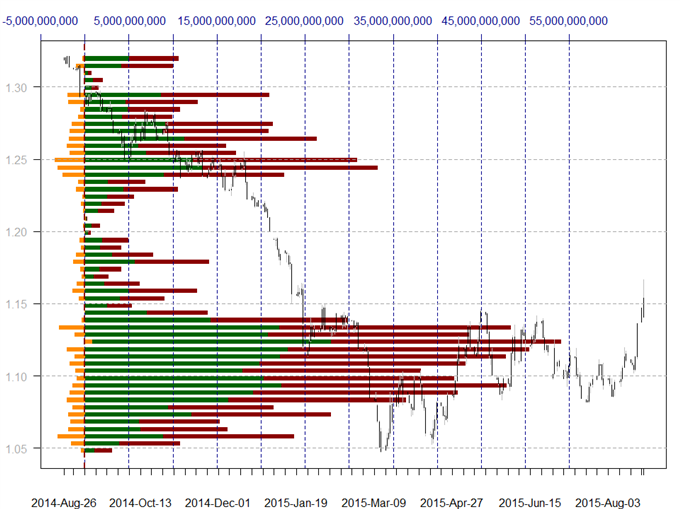
Data source: FXCM Real Directional Volume Indicator, Chart source: R. Prepared by David Rodriguez
The Euro surged beyond key resistance as it briefly broke to $1.17 versus the US Dollar, and the relative lack of further major resistance suggests risks remain for further advances. Support now starts at considerable volume-based congestion support near $1.14 and extends through $1.12. Resistance remains recent spike-highs at $1.17.
GBP/USD
Total Buy Volume Executed, Total Sell Volume Executed, Net Volume Executed (Buy-Sell)
Length of bar indicates the sum of Buy and Sell volume.
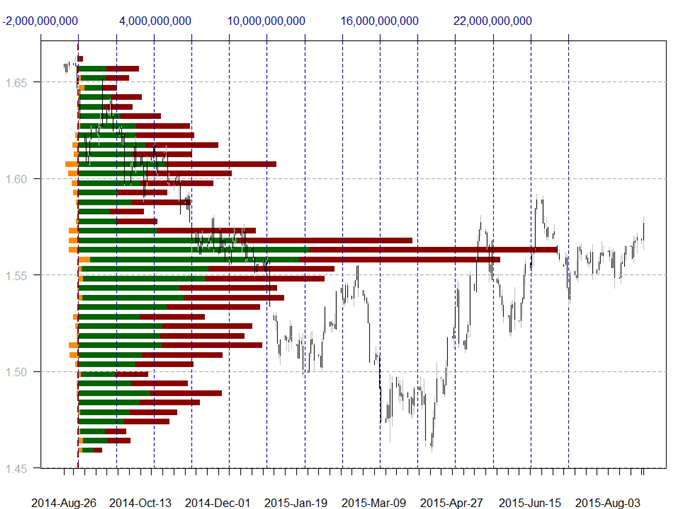
Data source: FXCM Real Directional Volume Indicator, Chart source: R. Prepared by David Rodriguez
After many successive attempts the British pound broke above key resistance in the $1.5650-1.5700 range versus the US Dollar, and risks are now seen to the topside for the suddenly-resurgent pair. Key support is now at former resistance starting at $1.5700, while the next topside target is the recent spike-high near $1.5810.
USD/JPY
Total Buy Volume Executed, Total Sell Volume Executed, Net Volume Executed (Buy-Sell)
Length of bar indicates the sum of Buy and Sell volume.
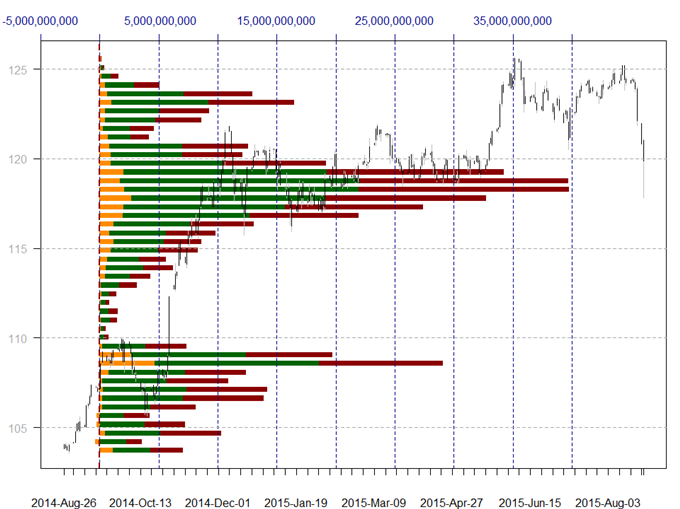
Data source: FXCM Real Directional Volume Indicator, Chart source: R. Prepared by David Rodriguez
The US dollar briefly crashed below key support versus the Japanese yen, falling below a major congestion zone starting near the ¥119 mark. Yet a similarly sharp reversal sees the pair back above key support, and it’s possible that the US Dollar resumes trading in a broad range versus the Yen. First it will be important to see it cross above key psychological resistance at ¥120, and support remains at ¥119.
AUD/USD
Total Buy Volume Executed, Total Sell Volume Executed, Net Volume Executed (Buy-Sell)
Length of bar indicates the sum of Buy and Sell volume.
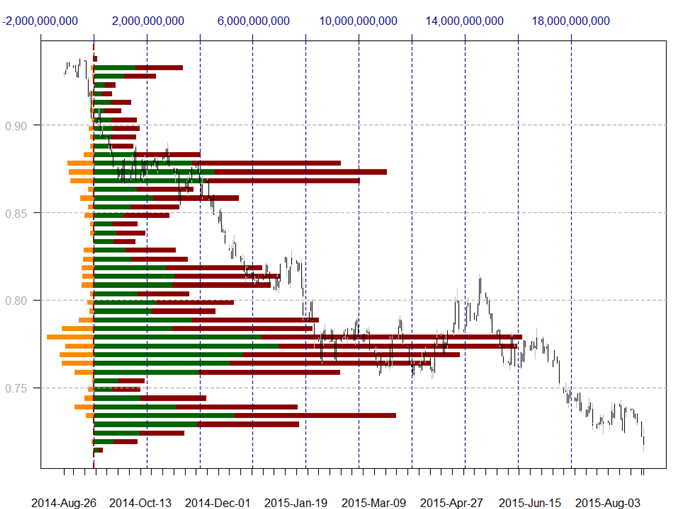
Data source: FXCM Real Directional Volume Indicator, Chart source: R. Prepared by David Rodriguez
The Australian dollar broke to further lows versus the US dollar, and the relative lack of major support levels leaves near-term trading risks to the downside. Near-term resistance is a major volume-based congestion level at $0.7400 and previous lows near $0.7250. The next downside target is the recent spike-low at $0.7050.
GBP/JPY
Total Buy Volume Executed, Total Sell Volume Executed, Net Volume Executed (Buy-Sell)
Length of bar indicates the sum of Buy and Sell volume.
Data source: FXCM Real Directional Volume Indicator, Chart source: R. Prepared by David Rodriguez
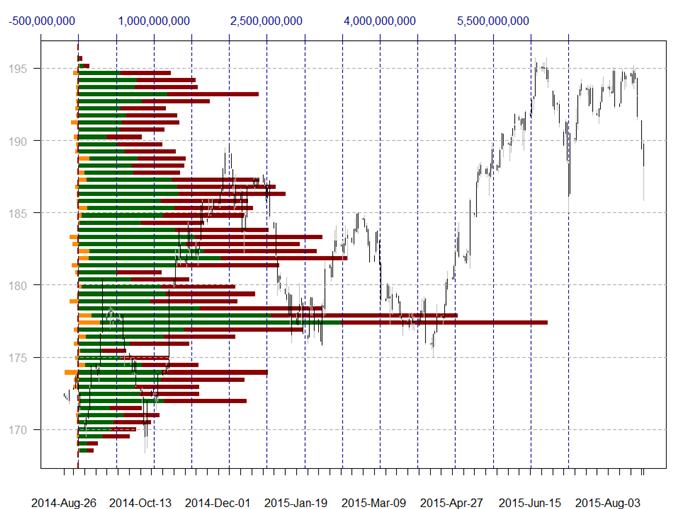
The British pound has tumbled through key support versus the Japanese yen, but its sharp declines stopped at previous spike-lows near ¥185. The pair now trades above key volume-based congestion near ¥186, and as long as it remains above risks seem weighed to the topside. Resistance starts at the psychologically-significant ¥190 level, while a break below ¥186 targets a return towards the spike-low closer to ¥183.
EUR/JPY
Total Buy Volume Executed, Total Sell Volume Executed, Net Volume Executed (Buy-Sell)
Length of bar indicates the sum of Buy and Sell volume.
Data source: FXCM Real Directional Volume Indicator, Chart source: R. Prepared by David Rodriguez
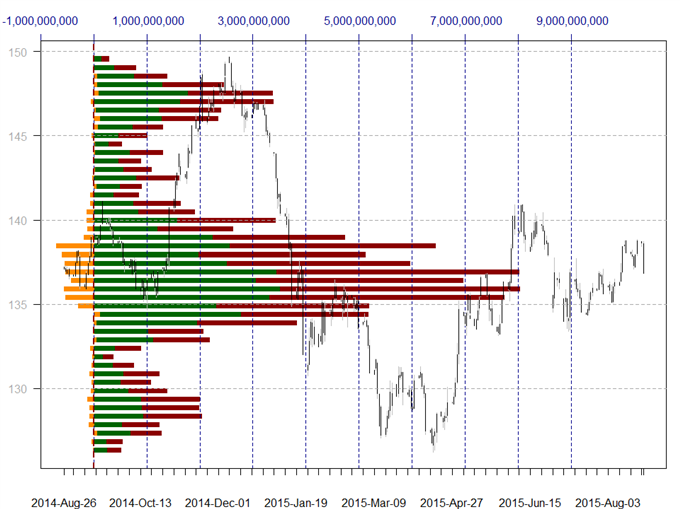
A recent euro reversal versus the yen leaves it almost squarely at major volume-based support near ¥137, and risks seem to favor further range-bound trading in the recently slow-moving pair. Major resistance is the recent spike-high near ¥139, but trading below ¥137 would instead make a move towards comparable congestion near ¥135 the next likely target.
USD/CAD
Total Buy Volume Executed, Total Sell Volume Executed, Net Volume Executed (Buy-Sell)
Length of bar indicates the sum of Buy and Sell volume.
Data source: FXCM Real Directional Volume Indicator, Chart source: R. Prepared by David Rodriguez
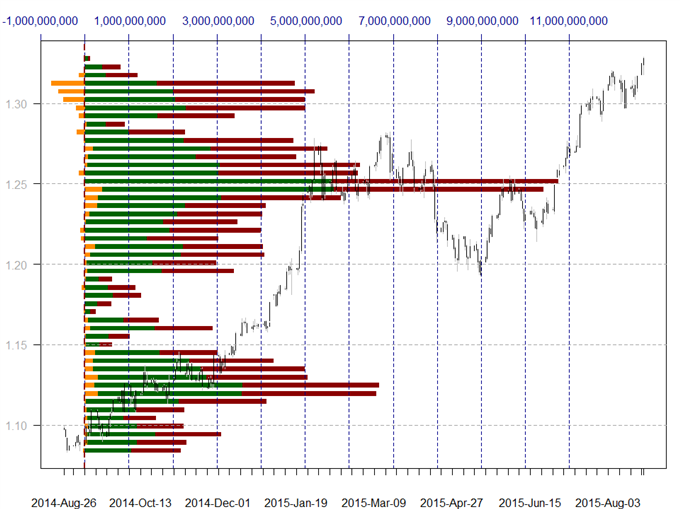
The US dollar trades comfortably above all major volume-based price resistance versus the Canadian dollar, and previous resistance now serves as support near C$1.3200. We need to go back to 2004 to see the next potential price target—a previous spike-high near C$1.3400. Trading below near-term support would make the psychologically-significant C$1.3000 mark the next target.
NZD/USD
Total Buy Volume Executed, Total Sell Volume Executed, Net Volume Executed (Buy-Sell)
Length of bar indicates the sum of Buy and Sell volume.
Data source: FXCM Real Directional Volume Indicator, Chart source: R. Prepared by David Rodriguez
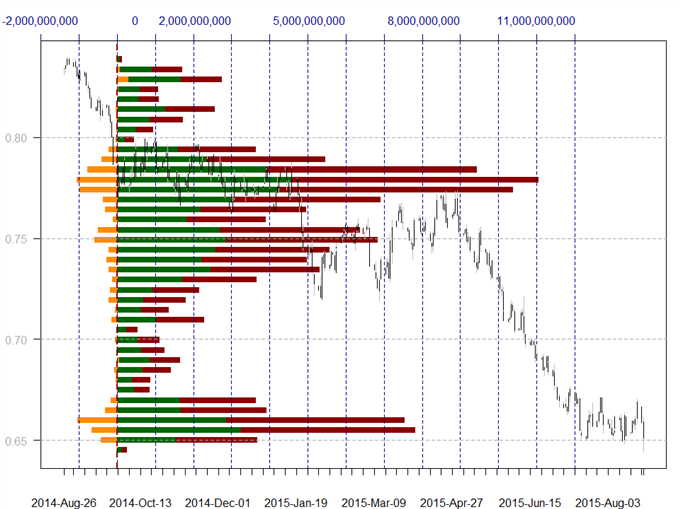
The New Zealand Dollar continues to trade just below major volume-based congestion in $0.6600-$0.6700 zone, and failure here keeps our focus on major lows closer to $0.6500. Recent volatility has proven insufficient to force a sustained break in either direction, but the violence with which the NZD fell through to major lows suggests risks remain to the downside.
--- Written by David Rodriguez, Quantitative Strategist for DailyFX.com
