
The USD and the CAD indices continue to move in bullish tandem, with the correlation between the two North American currencies at very elevated levels while the New Zealand dollar is the main mover today as traders react to a disastrous ANZ business confidence, around a decade low. This week includes volatile events to influence currency valuations, including the RBA policy meeting on Tuesday.
The Daily Edge is authored by Ivan Delgado, Market Insights Commentator at Global Prime.
Quick Take
The New Zealand Dollar is the main mover today as traders react to a disastrous ANZ business confidence, around a decade low. The Kiwi, alongside the Sterling, are the two currencies with the poorest performance in the last 24h, even if the British currency has landed into a pivotal daily demand imbalance area.
The surprise move by BOE hawk member Saunders into the dovish camp has deteriorated the outlook for the Pound at a fundamental level, as the market prices in a bigger role from the Central Bank as an influencing factor for the currency as hints were given that the Central Bank may start being more proactive in its policy setting regardless of a Brexit resolution.
The USD and the CAD continue to move in bullish tandem, with the correlation between the two North American currencies at very elevated levels. It's important to note that at an index level vs G8 FX, the Canadian Dollar has now officially broken into fresh highs for the year.
Short NZD/CAD has been a spectacular trade this year.
The Swissy has found renewed buying interest, underpinned by the return of demand for Euros last Friday, alongside the sell-off in US equities as chatter builds the US may limit investments into China. The Japanese Yen remains quite indecisive at an index level, compressed right in the middle on a week-long range that must first breakout to establish a more lasting bias. This week includes volatile events to influence currency valuations, including the RBA policy meeting on Tuesday, Canadian GDP, US ISM Manuf, US NFP or Fed's Powell speech.
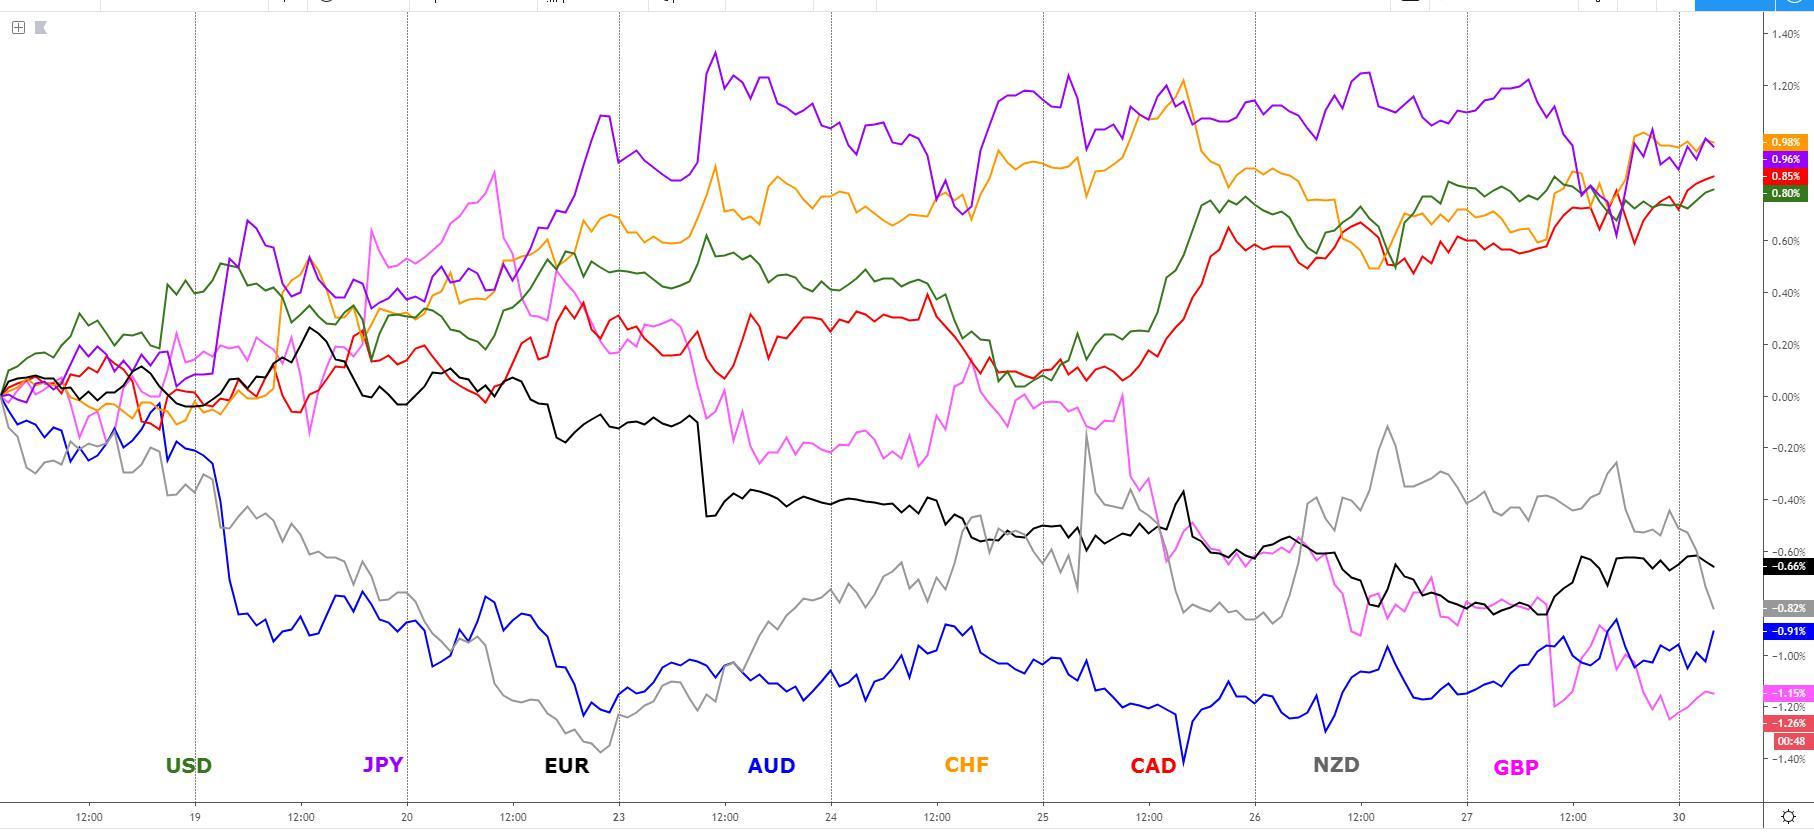
The indices show the performance of a particular currency vs G8 FX. An educational article about how to build your own currency meter can be found in the Global Prime's Research section.
Narratives In Financial Markets
* The Information is gathered after scanning top publications including the FT, WSJ, Reuters, Bloomberg, ForexLive, Institutional Bank Research reports.
US investment limits into China? The US equity market came under renewed selling pressure after Bloomberg reported that Trump is looking to limit investment by US companies in China, which would also affect the listing of Chinese companies on US exchanges.
On the latter threat, the US Treasury appeased fears by stating there are currently no plans to block Chinese companies from listing on US exchanges, which if true, would have a significant impact as there are over 150 Chinese listed firms on US exchanges with a combined market cap of over $1 trillion. It would also represent a major escalation in the ongoing trade (cold) war.
Risk off flows to end the week: Algos immediately picked up on the headlines regarding the restriction of investments to China, sending the S&P 500 down more than 1% even if rich dip buying activity was present, as the daily candle closes reveals, with a considerable absorption of offers.
Once again, the gyrations in the Forex market, when compared to the outsized movements in stocks, were rather muted with the Swiss Franc and the Japanese Yen advancing ground late in the US session as risk averse flows made an abrupt comeback.
US data uneventful, won't alter Fed view: The core durable goods came upbeat at +0.5% m/m vs 0.2% expected, which represents a third month of consecutive gains even if business spending disappointed in line with the view that the trade war and the effects of technology are putting off enterprises from investing back into the real economy.
Adam Button from ForexLive shared some valuable insights in a video as to why businesses are not spending. On the flip side, real personal spending came downbeat at +0.1% m/m vs 0.3% expected.
The PCE deflator was also below consensus at 0.1% m/m vs 0.2% expected. Judging by the US domestic conditions, the stubbornly solid data through most of the summer season has set the bar quite high for the Fed to keep easing in the near term even if the market still disagrees based on what's priced in.
Fed's Harker in wait and see mode: The current overarching view by the market on where the Fed stands was well described by Fed’s Harker, a non-voter of the Board, who said
“My own view is that we should hold firm, letting things settle and watching out events play out.”
Haker, nonetheless, remains concerned of the headwinds ahead, noting “what I worry about, is if we start to see things drift down significantly, I’d be open to a rate cut, but not now.”
BOE Saunders turns dovish: The GBP was sent into a tailspin after BOE hawk member Saunders turned dovish, saying it is "quite plausible" for BoE's next move to be a cut even if no-deal Brexit is avoided, adding a sense of urgency to lower rates by noting that “deferring monetary policy changes until after Brexit could lead to inappropriate policy.”
These headlines represent a sea change in how the BoE might potentially be approaching its policy settings, no longer idle on the sidelines waiting for a resolution of Brexit. The BoE looks set to act as a more important driver of GBP flows from now on, which implies that traders should pay closer attention to the bond yield differentials.
Saudi Arabia agrees ceasefire in Yemen: As the WSJ reports, Saudi Arabia agreed to a partial ceasefire in Yemen following the surprise move by Yemen's Houthi rebels to declare a unilateral cease fire in what’s seen as a huge turnaround of events, as it’s been only weeks since they claimed an attack on Saudi Arabia's oil industry.
The price of oil saw a contained downside reaction to the news, as the focus is much more anchored towards the rhetoric around a Saudi Arabia vs Iran conflict.
NZD under the cosh after ANZ business confidence: The NZD under performed through the Morning Asian session after the New Zealand business confidence for September came at -53.5 from -52 last, with the business activity outlook at -1.8, the lowest it’s been since 2008/09.
In the official note, ANZ notes that “investment intentions and profit expectations both fell to dismal levels with costs, pricing intentions, and inflation expectations were all weaker.” The news is a reality check for those looking to keep NZD long exposure on the basis that the RBNZ may not be as dovish. The evidence continues to be that RBNZ Governor Orr must keep the foot on the ‘easing’ gas pedal.
USD scarcity remains a hot topic: The NY Fed is now conducting repo operation to the tune of 160bn per day to mitigate the risks of a shortfall in USD funding, which in words of the Strategy Team at Nordea, "dollar scarcity will eventually lead the Fed to start buying Treasuries again, a debate around which is now clearly gathering pace."
The team notes that if the Fed were to boost excess liquidity by 250bn via the same amount of bond purchases over two quarters in a permanent open market operation (POMO), "it would be good news for risk sentiment and bad news for the dollar, though how good both should and will be argued about in the months to come."
Recent Economic Indicators & Events Ahead
Tuesday’s RBA monetary policy meeting is the next focus, where expectations for a cut in rates has tempered out ever since the less dovish-than-expected speech by Governor Lowe last week, even if it remains the base case. The market is still pricing in a 79% chance of a cut on Tuesday.
According to NAB Strategists, “the risk is the Statement itself is largely neutral despite the RBA having cut rates, while Dr Lowe has consistently given an optimistic tone, repeating his ‘gentle turning point’ phrase at his most recent speech.” In terms of new US-China trade developments, the newsflows should be kept relatively light as China goes through its Golden Week holidays from October 1-7.

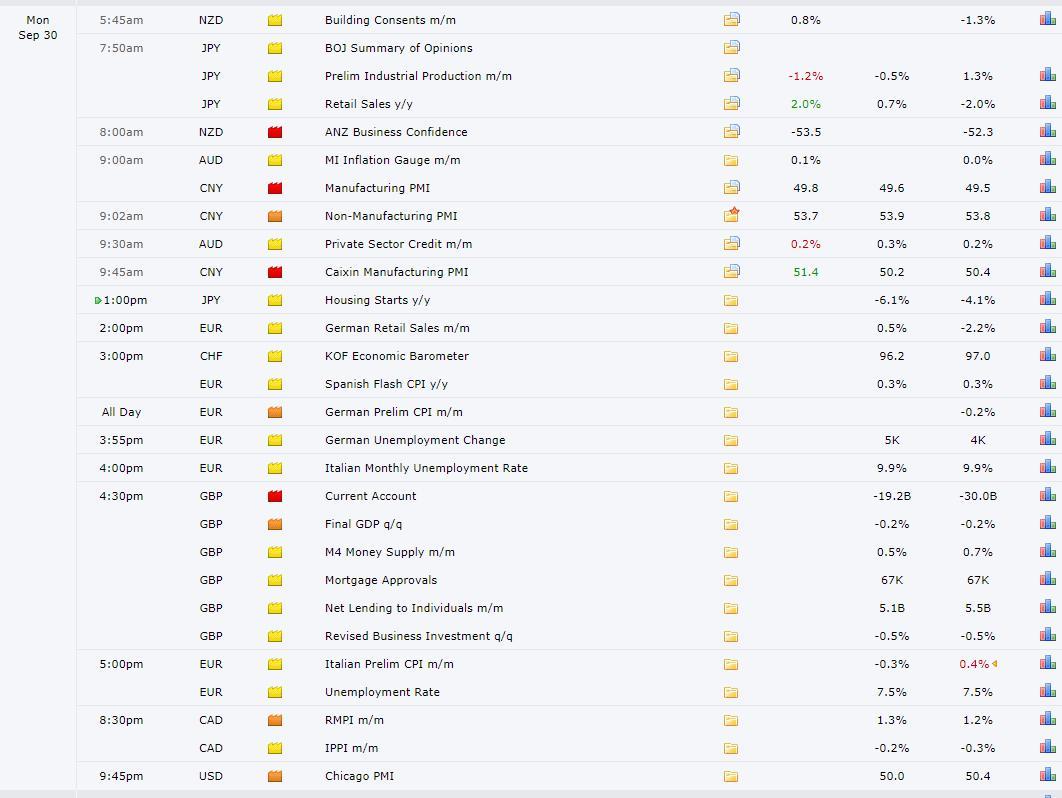
Source: Forexfactory
A Dive Into The Charts
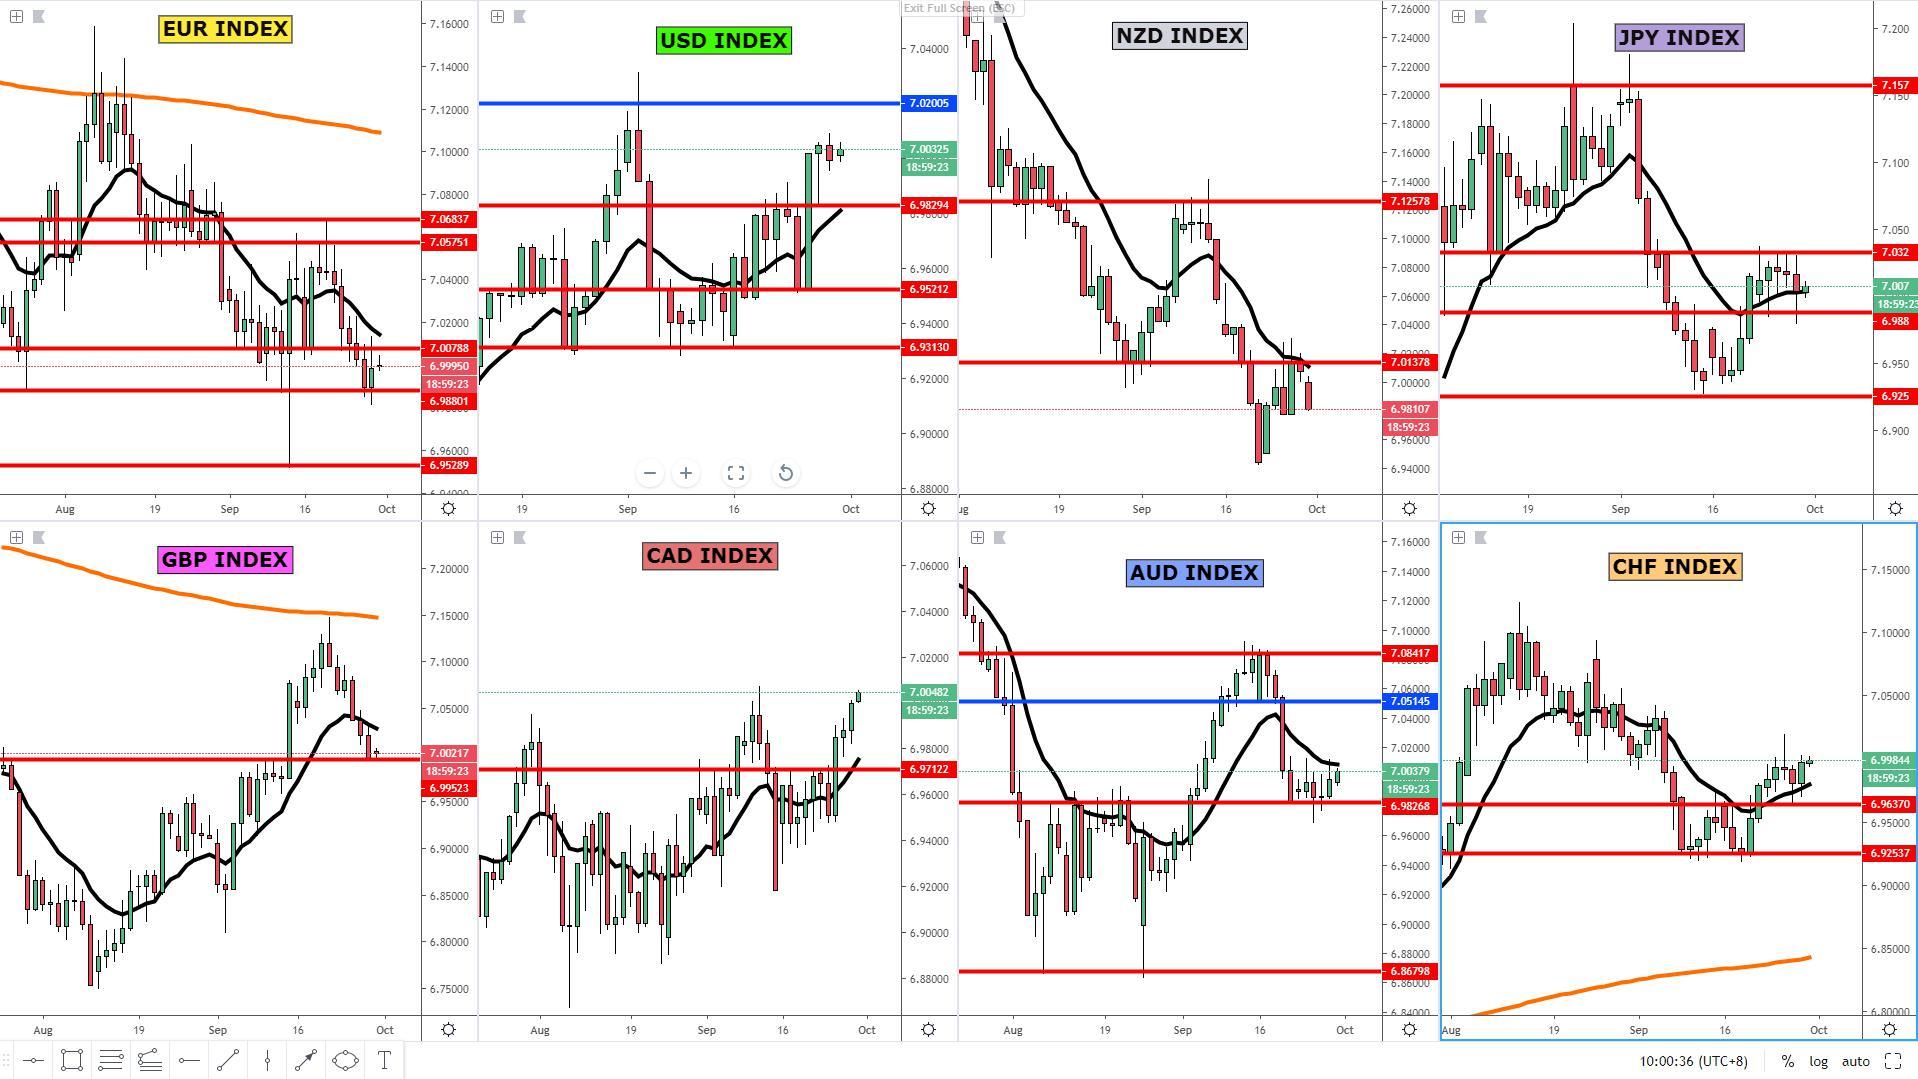
The indices show the performance of a particular currency vs G8 FX. An educational video on how to interpret these indices can be found in the Global Prime's Research section.
The EUR index bounced off an identified daily level of horizontal support in the chart where a boost in demand imbalances was expected, which as it’s usually the case, we couldn’t have spotted unless one follows the aggregate flows vs G8 FX.
The decisive move away from the lows is still quite limiting in nature with the upside likely capped by the bearish baseline. Be aware after Friday’s price action, where a significant absorption of the buy-side pressure eventuated, with the price kept below a recently broken yet critical area of resistance, sellers are still keeping the upper hand to continuously exert downward pressure.
The GBP index is one to watch early this week as the currency has finally landed into a the origin of demand from back on Sept 13. As one would expect, the GBP has stalled its fall at precisely this level of demand imbalance where the carving out of a meaningful bottom could eventuate.
If there is an area to be on high alert for renewed opportunities to exploit long GBP plays, this is it. Do monitor incessantly the Brexit and BoE news flows though, as that’s going to have a major influence on the ability of the level to hold its ground and buyers to stay committed.
The USD index is on a clear bullish trend and other than a 8h supply imbalance identified, which shouldn’t represent much of an impediment other than a short-term hiccup, the path of least resistance is to the upside.
Strategies that orbit around dip buying activity should do well. Note, the latest setback on the USD last Thursday was bought back with decisiveness, with has set out the bullish inertia to at least retest this year’s trend high. You must be well aware that carrying short USD exposure at the open of the week is a very risky proposition as the index stands.
The CAD index is on fire with no signs of the demand flows abating anytime soon. The most recent trend high, which constitutes the highest since Oct 24 2018, is about to be taken out.
If you are a momentum-based trader, this is a market with appeal to gain exposure into, although if your interest is on finding value in your entries with a swing trading approach, move on, this is not a market that offers any type of discount for those trading from an hourly or above.
The NZD index appears set to resume its downtrend all the way until retesting its trend lows again, following the horrendous ANZ business confidence print, which has reinvigorated an avalanche of offers into the NZD, which is back being the most vulnerable currency in G8 FX.
There is still ample room to the downside (over 0.5%) to exploit the weakness in the NZD, in what’s arguably the market with the clearest technical evidence to remain a seller.
The AUD index kept finding demand off a daily horizontal support, with the price action unfolding ever since the level was tested last week in line with one of the scenario expected, that is, the imbalance of demand has led to a retest of the baseline (13d ema), where sellers stepped in.
This leaves us with a rather neutral picture in which buyers are looking to exert control even if one must be reminded that the next bias won’t come from technicals alone but rather, it will also be heavily influenced by the RBA policy meeting due on Tuesday this week.
The JPY index is sandwiched between an upper horizontal resistance level that has proven to be a reliable fortress for the interest of sellers over the last week, and a lower horizontal support, which has so far acted as an excellent reactionary area to see a change in flows as it represents a backside retest of the double top broken through Sept 20th.
For now, the outlook of the Japanese Yen remains unclear in the context of a compressed range, which makes the edges of the box it trades in by far the best levels to maximize one’s risk reward opportunities.
The CHF index is well positioned to keep extending Friday’s gains, which as a reminder, came on the back of a retest of a well-telegraphed horizontal support level on the daily.
If one looks to engage in these areas by matching up the expected demand flows against the weakest alternatives and/or currencies with supply imbalance levels near-by, that’s how you can make sure that more often than not you can spot meaningful turning points in the market. Overall the Swissy looks poised to see follow through continuation this Monday.
Important Footnotes
- Risk model: The fact that financial markets have become so intertwined and dynamic makes it essential to stay constantly in tune with market conditions and adapt to new environments. This prop model will assist you to gauge the context that you are trading so that you can significantly reduce the downside risks.
- Cycles: Markets evolve in cycles followed by a period of distribution and/or accumulation.
- POC: It refers to the point of control. It represents the areas of most interest by trading volume and should act as walls of bids/offers that may result in price reversals. The volume profile analysis tracks trading activity over a specified time period at specified price levels. The study reveals the constant evolution of the market auction process.
- Tick Volume: Price updates activity provides great insights into the actual buy or sell-side commitment to be engaged into a specific directional movement. Studies validate that price updates (tick volume) are highly correlated to actual traded volume, with the correlation being very high, when looking at hourly data.
- Horizontal Support/Resistance: Unlike levels of dynamic support or resistance or more subjective measurements such as fibonacci retracements, pivot points, trendlines, or other forms of reactive areas, the horizontal lines of support and resistance are universal concepts used by the majority of market participants. It, therefore, makes the areas the most widely followed and relevant to monitor.
- Trendlines: Besides the horizontal lines, trendlines are helpful as a visual representation of the trend. The trendlines are drawn respecting a series of rules that determine the validation of a new cycle being created. Therefore, these trendline drawn in the chart hinge to a certain interpretation of market structures.
- Correlations: Each forex pair has a series of highly correlated assets to assess valuations. This type of study is called inter-market analysis and it involves scoping out anomalies in the ever-evolving global interconnectivity between equities, bonds, currencies, and commodities.
- Fundamentals: It’s important to highlight that the daily market outlook provided in this report is subject to the impact of the fundamental news. Any unexpected news may cause the price to behave erratically in the short term.
- Projection Targets: The usefulness of the 100% projection resides in the symmetry and harmonic relationships of market cycles. By drawing a 100% projection, you can anticipate the area in the chart where some type of pause and potential reversals in price is likely to occur, due to 1. The side in control of the cycle takes profits 2. Counter-trend positions are added by contrarian players 3. These are price points where limit orders are set by market-makers.