Get 40% Off
🚨 Volatile Markets? Find Hidden Gems for Serious Outperformance
Find Stocks Now

U.S. Stock Market Stalls Near A Double Peak

Published 07/20/2020, 02:18 PM
Updated 07/09/2023, 06:31 AM

The U.S. stock market stalled early this week as earnings started to hit. A number of news and other items are pending, with earnings just starting to roll in. There have been some big numbers posted from JP Morgan  (NYSE:JPM) and Goldman Sachs (NYSE:GS).  Yet, the markets have reacted rather muted to these blowout revenues.

We believe this is a technical “Double Top” set up in the making. The NASDAQ has been much weaker than the S&P 500 and the Dow Jones Industrial Average. We believe the U.S. stock market is reacting to the reality of earnings and forward guidance after the recent rally in price levels over the past 9+ weeks. If we are correct and this Double-Top pushes price levels lower, then this technical resistance level may
become the price ceiling headed into Q3 and Q4 2020.

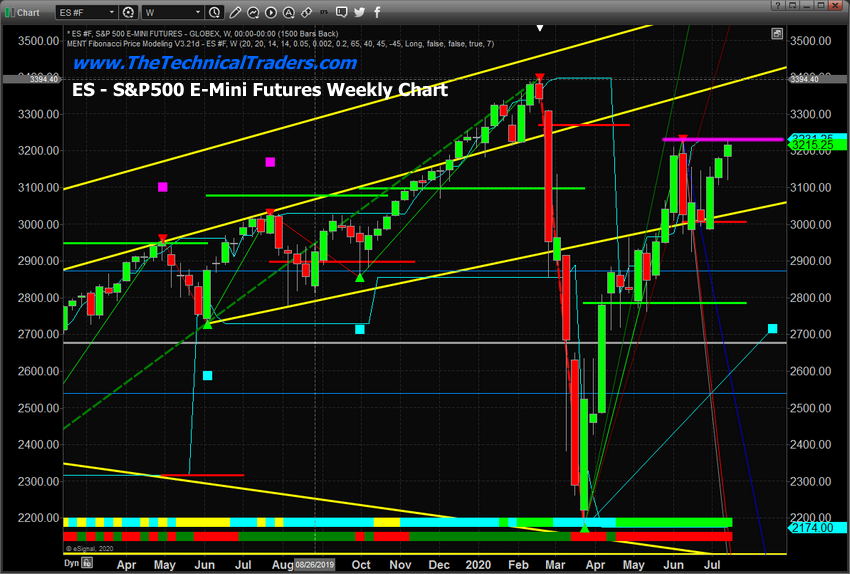
E-mini S&aP 500, Weekly chart

This ES, E-mini S&P, Weekly chart highlights the technical Double Top pattern that we believe will become a major price ceiling as earnings and other economic data continues to be released. This is a perfect example of how technical patterns align with fundamental data to present very clear trading signals. If the resistance near 3220 holds as we expect, the ES price level should begin to move lower attempting to target the 3000 level.

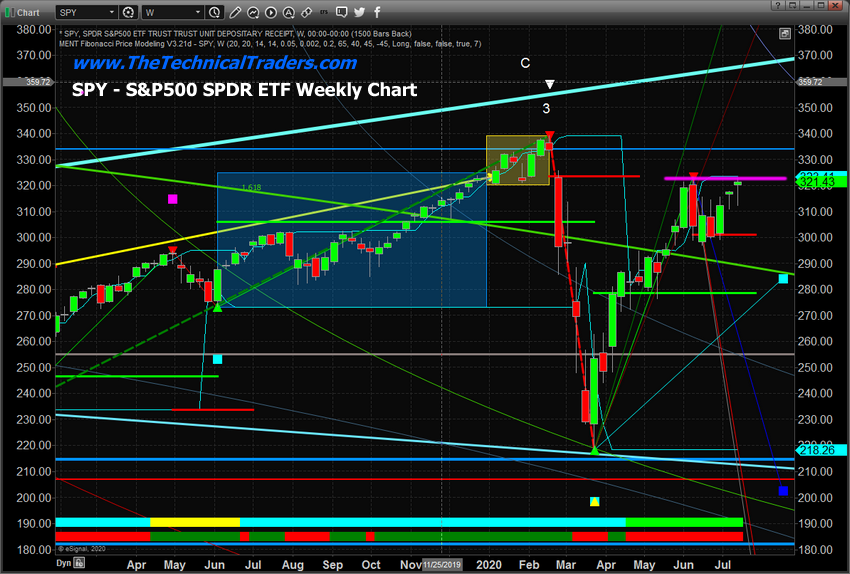
SPY ETF Weekly Chart

This SPY ETF Weekly chart highlights the similar Double-Top pattern that has setup further indicates strong resistance near $322 – which aligns with the original Fibonacci Bearish Trigger Level from the February peak levels (the solid RED line). The Double-Top setup near the Fibonacci Bearish Trigger level suggests a very strong resistance level that exists near $322. It is our opinion that this Double-Top setup near strong resistance will likely push the SPY into a downside price trend targeting $300 or lower.

3rd party Ad. Not an offer or recommendation by Investing.com. See disclosure here or remove ads .

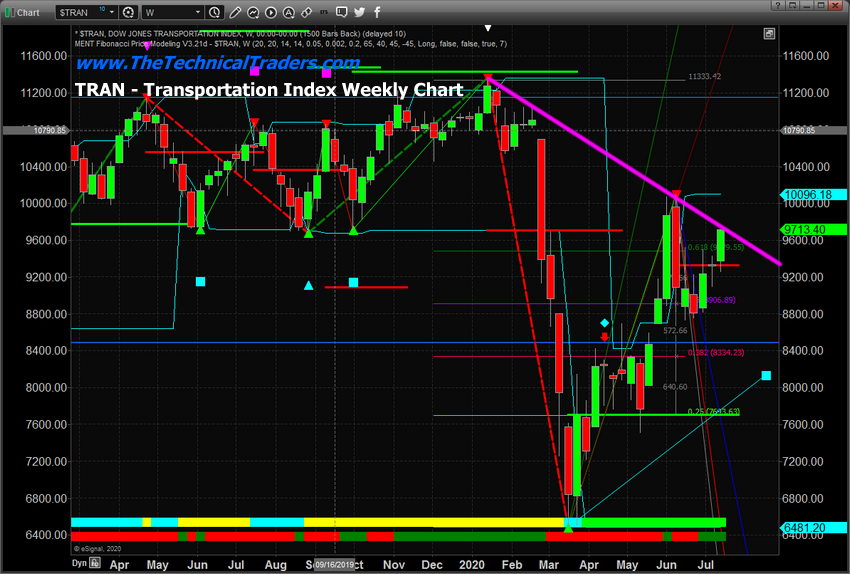
Transportation Index Weekly Chart

This Transportation Index Weekly chart highlights a different type of resistance price pattern – a downward sloping price channel peak. Unlike a Double-Top pattern, when price creates unique high price peaks that align into a price channel, we can attempt to use this channel as a price resistance channel going forward. In this case, the peak price level in February 2020 and the peak price level in June 2020 creates a very clear downward price channel that matches the current price peak perfectly. 

It is our opinion that this peak level will act as strong price resistance in the Transportation Index and should prompt a downside price trend targeting $8,900 to $9,000 or lower.

As global traders and investors continue to trade the forward expectations and earnings data that will last another 4+ weeks, we have to be prepared, as skilled technical traders, to trade any decent price moves that initiate as a result of price reacting to this technical resistance and moving lower. As technical traders, we will wait for confirmation of a trading signal before jumping into a trade from these levels. This makes a big difference in terms of accuracy.  Once we receive a confirmation of the technical pattern, we believe the trade has a much higher accuracy ratio.

In closing, be prepared for bigger downside price trends as this technical resistance works through the markets. After the peak in June 2020 and the setup of this Double-Top pattern, our researcher team believes a downside price move from current levels is highly likely.

3rd party Ad. Not an offer or recommendation by Investing.com. See disclosure here or remove ads .

Latest comments

Chris is almost always wrong, ES will be around 4K next year around Jan 2021. Nasdaq will double in 2 years.
Excuse me guys I' ve follow this guy for some time he is usually right. It is just a question of patience.
It is strange that any counter comments are erased from comments. I wrote something 6 hrs back but are absent.Such attitude may be avoided as healthy criticism is always welcomed.Analyst have an opinion but it will work if in line with Fed
it has to hold,I hope you guys know that. just because it closed above it doesn't mean it will stay there. if after this week, sure.
Horrible article if this is all it takes to be considered a market analyst sign ne up. Do a little more dd before typing up an article
This post aged poorly only 3 hours later
This post is getting better with age...
To many trees you can’t see the forest ...... I.e . To many lines.
Dear may I request you to please have a look back on your earlier analysis and insistence on pending double bottom .
Chris, thanks for the analysis. The SPX is currently around 3245. Where do you think it needs to close to confirm either a double top or a potential melt-up?
Risk Disclosure: Trading in financial instruments and/or cryptocurrencies involves high risks including the risk of losing some, or all, of your investment amount, and may not be suitable for all investors. Prices of cryptocurrencies are extremely volatile and may be affected by external factors such as financial, regulatory or political events. Trading on margin increases the financial risks.
Before deciding to trade in financial instrument or cryptocurrencies you should be fully informed of the risks and costs associated with trading the financial markets, carefully consider your investment objectives, level of experience, and risk appetite, and seek professional advice where needed.
Fusion Media would like to remind you that the data contained in this website is not necessarily real-time nor accurate. The data and prices on the website are not necessarily provided by any market or exchange, but may be provided by market makers, and so prices may not be accurate and may differ from the actual price at any given market, meaning prices are indicative and not appropriate for trading purposes. Fusion Media and any provider of the data contained in this website will not accept liability for any loss or damage as a result of your trading, or your reliance on the information contained within this website.
It is prohibited to use, store, reproduce, display, modify, transmit or distribute the data contained in this website without the explicit prior written permission of Fusion Media and/or the data provider. All intellectual property rights are reserved by the providers and/or the exchange providing the data contained in this website.
Fusion Media may be compensated by the advertisers that appear on the website, based on your interaction with the advertisements or advertisers.
© 2007-2024 - Fusion Media Limited. All Rights Reserved.