Some of my best friends live in Texas. However, I’ve misjudged them so far. I didn’t expect that they would continue to pump more and more crude oil despite the plunge in oil prices and the free-fall in the US oil rig count. Let’s drill down and see what we find:
(1) US production. US crude oil field production rose to another new high of 9.4mbd during the 3/13 week, with output still rising in both Texas (to 3.9mbd) and North Dakota (to 1.2mbd).
(2) US inventories and trade. US crude oil stocks rose 22% y/y to a record 458.5 million barrels during the week of March 13. There are mounting concerns that the US is running out of storage capacity, which could cause a further collapse in crude oil prices. US refineries are working overtime to convert crude oil--which the government bans from exporting--into refined products, which can be exported. During the 3/13 week, US exports of crude oil and petroleum products rose to a record 4.4mbd (with crude accounting for just 0.5mbd of this total), up 3.2mbd since the start of 2008.
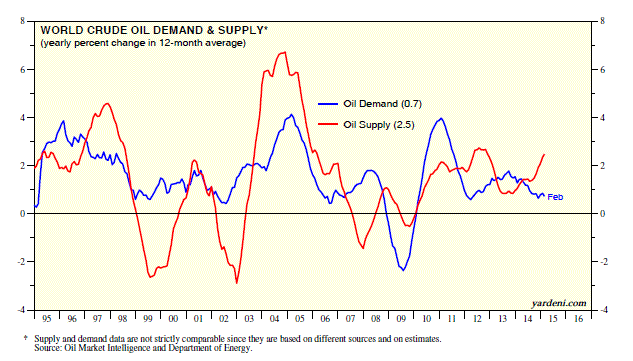
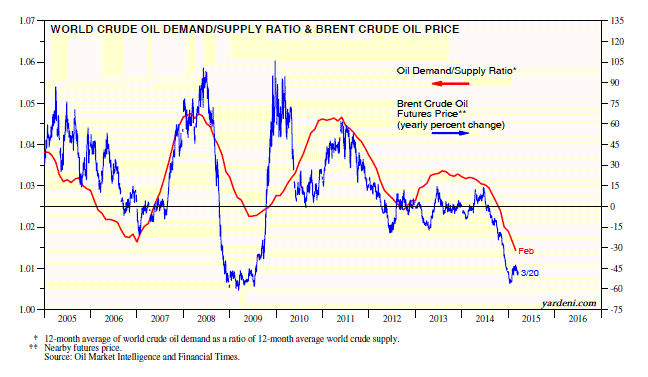
(3) Global supply and demand. Data compiled by Oil Market Intelligence show that over the past 12 months through February, global oil supply is up 2.5% y/y, while demand is up 0.7%. I calculate a demand/supply ratio using these data. It has been highly correlated with the y/y percentage change in the price of a barrel of Brent crude oil since 2005. The ratio has been increasingly bearish since mid-2013, and was down last month to 1.01, the lowest since January 1999.
(4) Geopolitics. The Saudis triggered the latest price drop in early October of last year when they cut their oil prices rather than their production. That’s because North American frackers have flooded the world market with so much oil that the Saudis are aiming to shut them down with lower prices. It’s not working so far. The US and Canada produced 13.2mbd during February, up 4.0mbd since August 2012. That well exceeds the Saudi’s 9.6mbd.
Despite the invasion by ISIS forces, Iraqi oil production remained high at 3.4mbd during February, helping to offset the drop in Iranian output since early 2012, when sanctions were imposed on the country. The big concern is that if Iran agrees to a nuclear deal with the US, then the sanctions will be lifted. If so, there could be another 1.0mbd flooding the flooded global oil market.
Today's Morning Briefing: No Shortage of Gluts. (1) Easy money boosting supply more than demand. (2) Maxed out credit. (3) Disinflation with a whiff of deflation. (4) Flood of liquidity. (5) Yellen, Einstein, and the “insanity trade.” (6) June rate hike less certain. (7) Guidance of endless possibilities. (8) Fed funds forecast to three decimal points. (9) None- or one-and-done remain in play. (10) Texas still gushing oil. (11) Global oil demand/supply ratio still falling. (12) Trigger-happy Saudis have met their match in US frackers. (13) Iran deal would add to oil glut. (14) Natural gas analogy. (15) Lowering S&P 500 Energy to market weight while waiting for production to fall.

