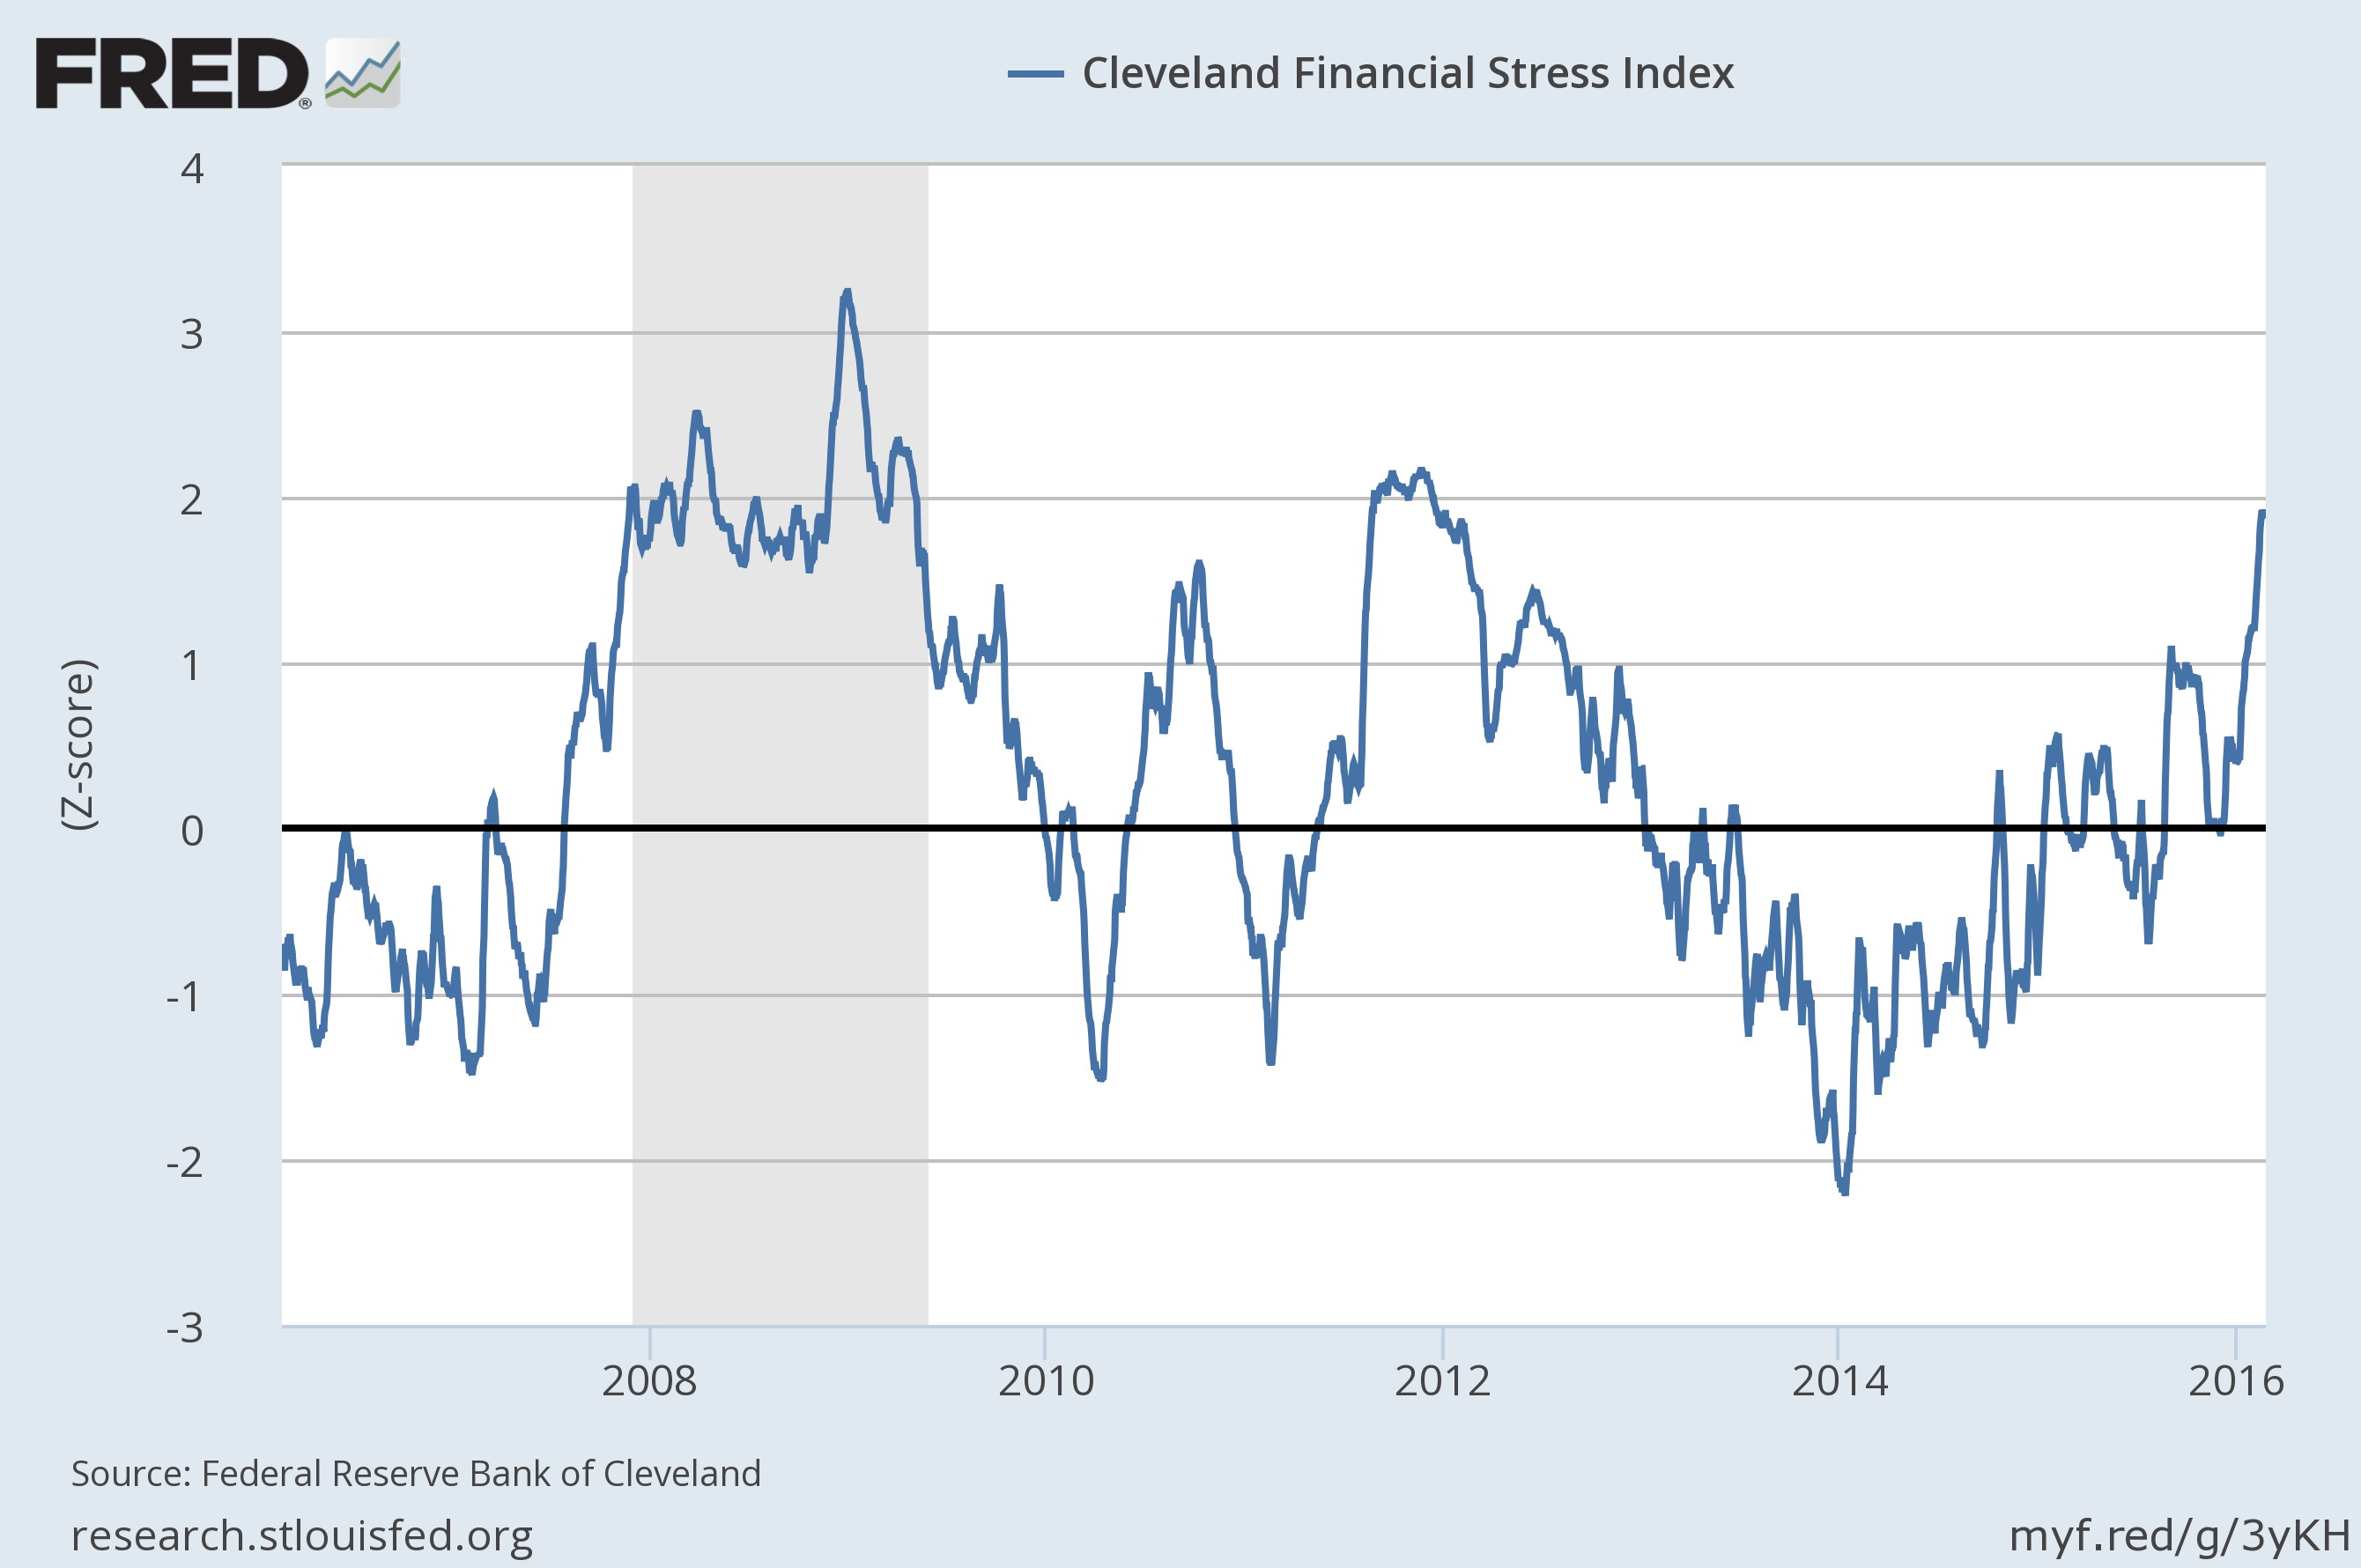
Financial stress in the US continues to trend upward, according to four benchmarks published by Federal Reserve banks. The numbers overall suggest that stress in the financial system is at the highest level in three to four years, depending on the index. One benchmark—the Cleveland Financial Stress Index—is currently signaling “significant stress” for the first time since early 2012.
In other words, another risk factor for the US economy is at or near the critical level. As a result, the economy has a lesser capacity for absorbing a new shock. That alone doesn’t mean that there’s trouble brewing, but there’s a greater degree of macro fragility due to heightened financial stress, according to the Cleveland Financial Stress Index. Note that the other three Fed stress indexes are currently indicating lesser degrees of risk, although that may be due to the fact that these benchmarks are lagging the higher-frequency updates for the Cleveland index.
Let’s take a closer look at all the numbers via the St. Louis Fed’s FRED database that collects the data on four indexes that quantify stress across a range of factors. Each benchmark uses a different methodology and dataset and so reviewing all of the indexes offers a relatively robust, diversified profile of risk in the US financial system. Here’s a summary of current readings, based on figures collected this morning (Feb. 24):
Cleveland Fed US Financial Stress Index: This daily index from the Federal Reserve Bank of Cleveland has increased to a four-year high, although it’s pulled back slightly in recent days. Nonetheless, the +1.87 reading for Feb. 22 is considered a “significant” stress level–the highest reading possible for this benchmark.
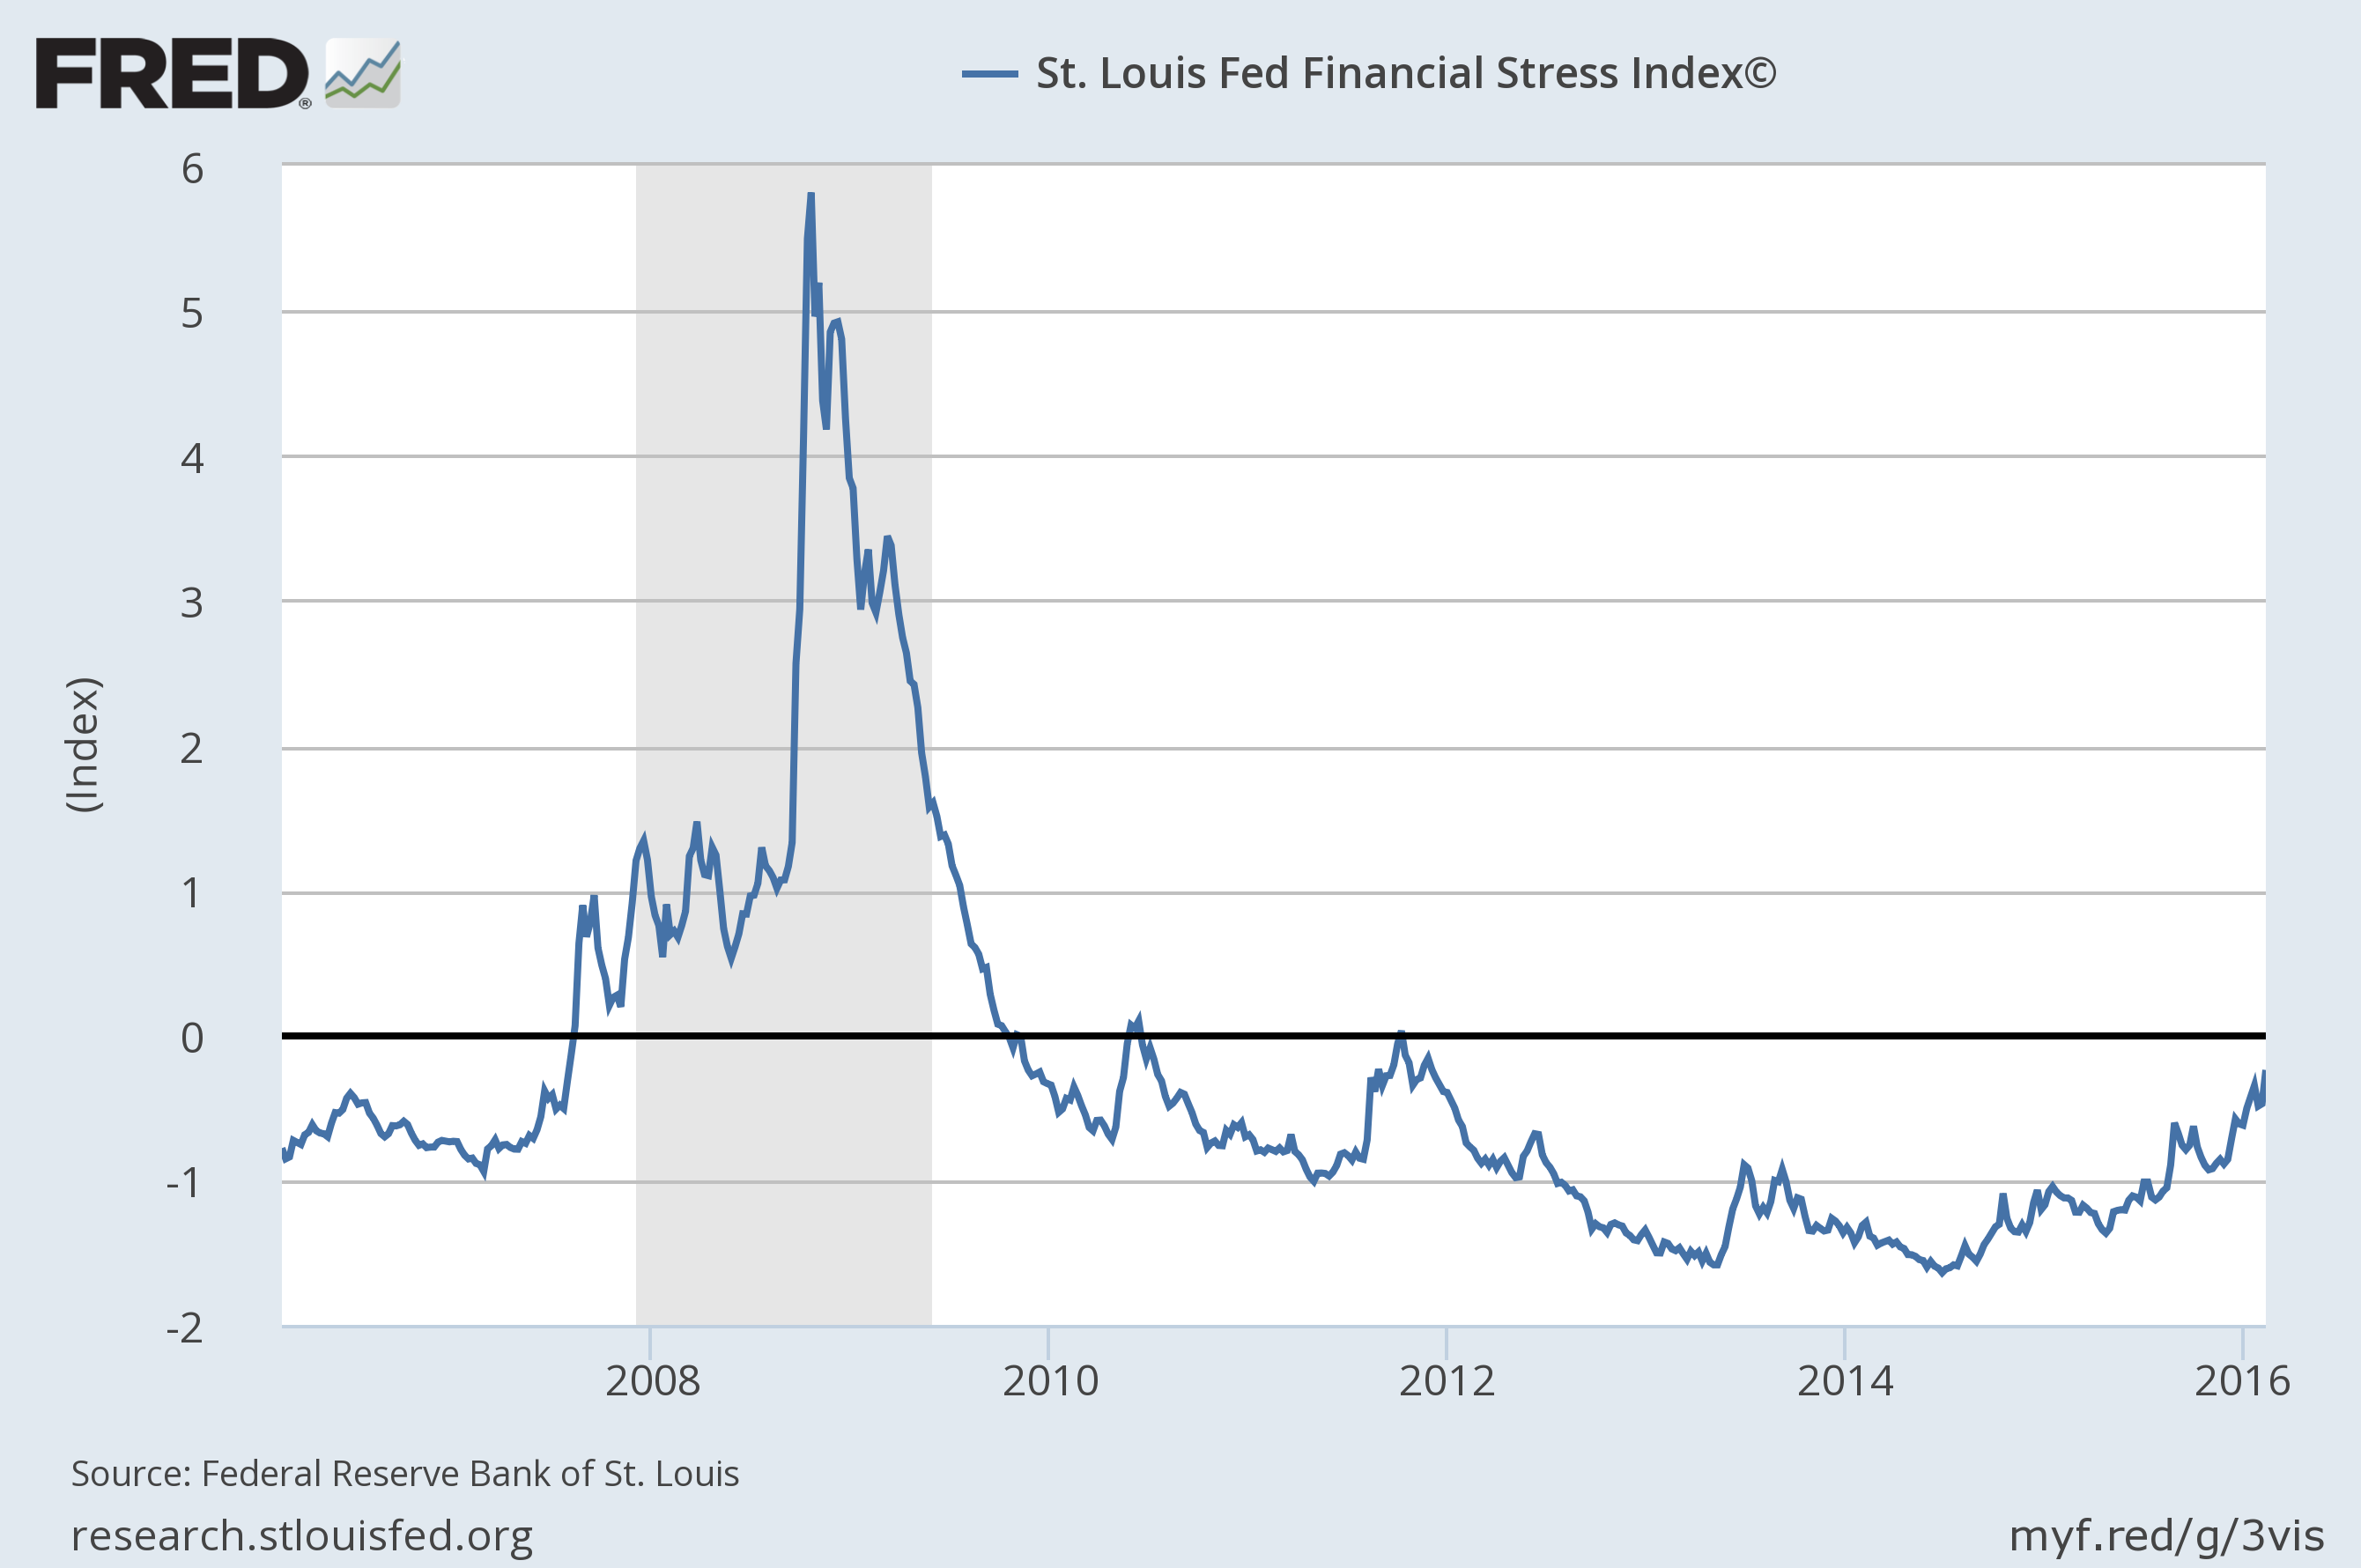
St. Louis Fed US Financial Stress Index: This weekly measure of financial stress has been trending higher in recent months, reaching -0.241 for the week through Feb. 12—the highest since late-2011. Despite the latest increase, the current below-zero reading reflects “below-average market stress,” according to the St. Louis Fed.
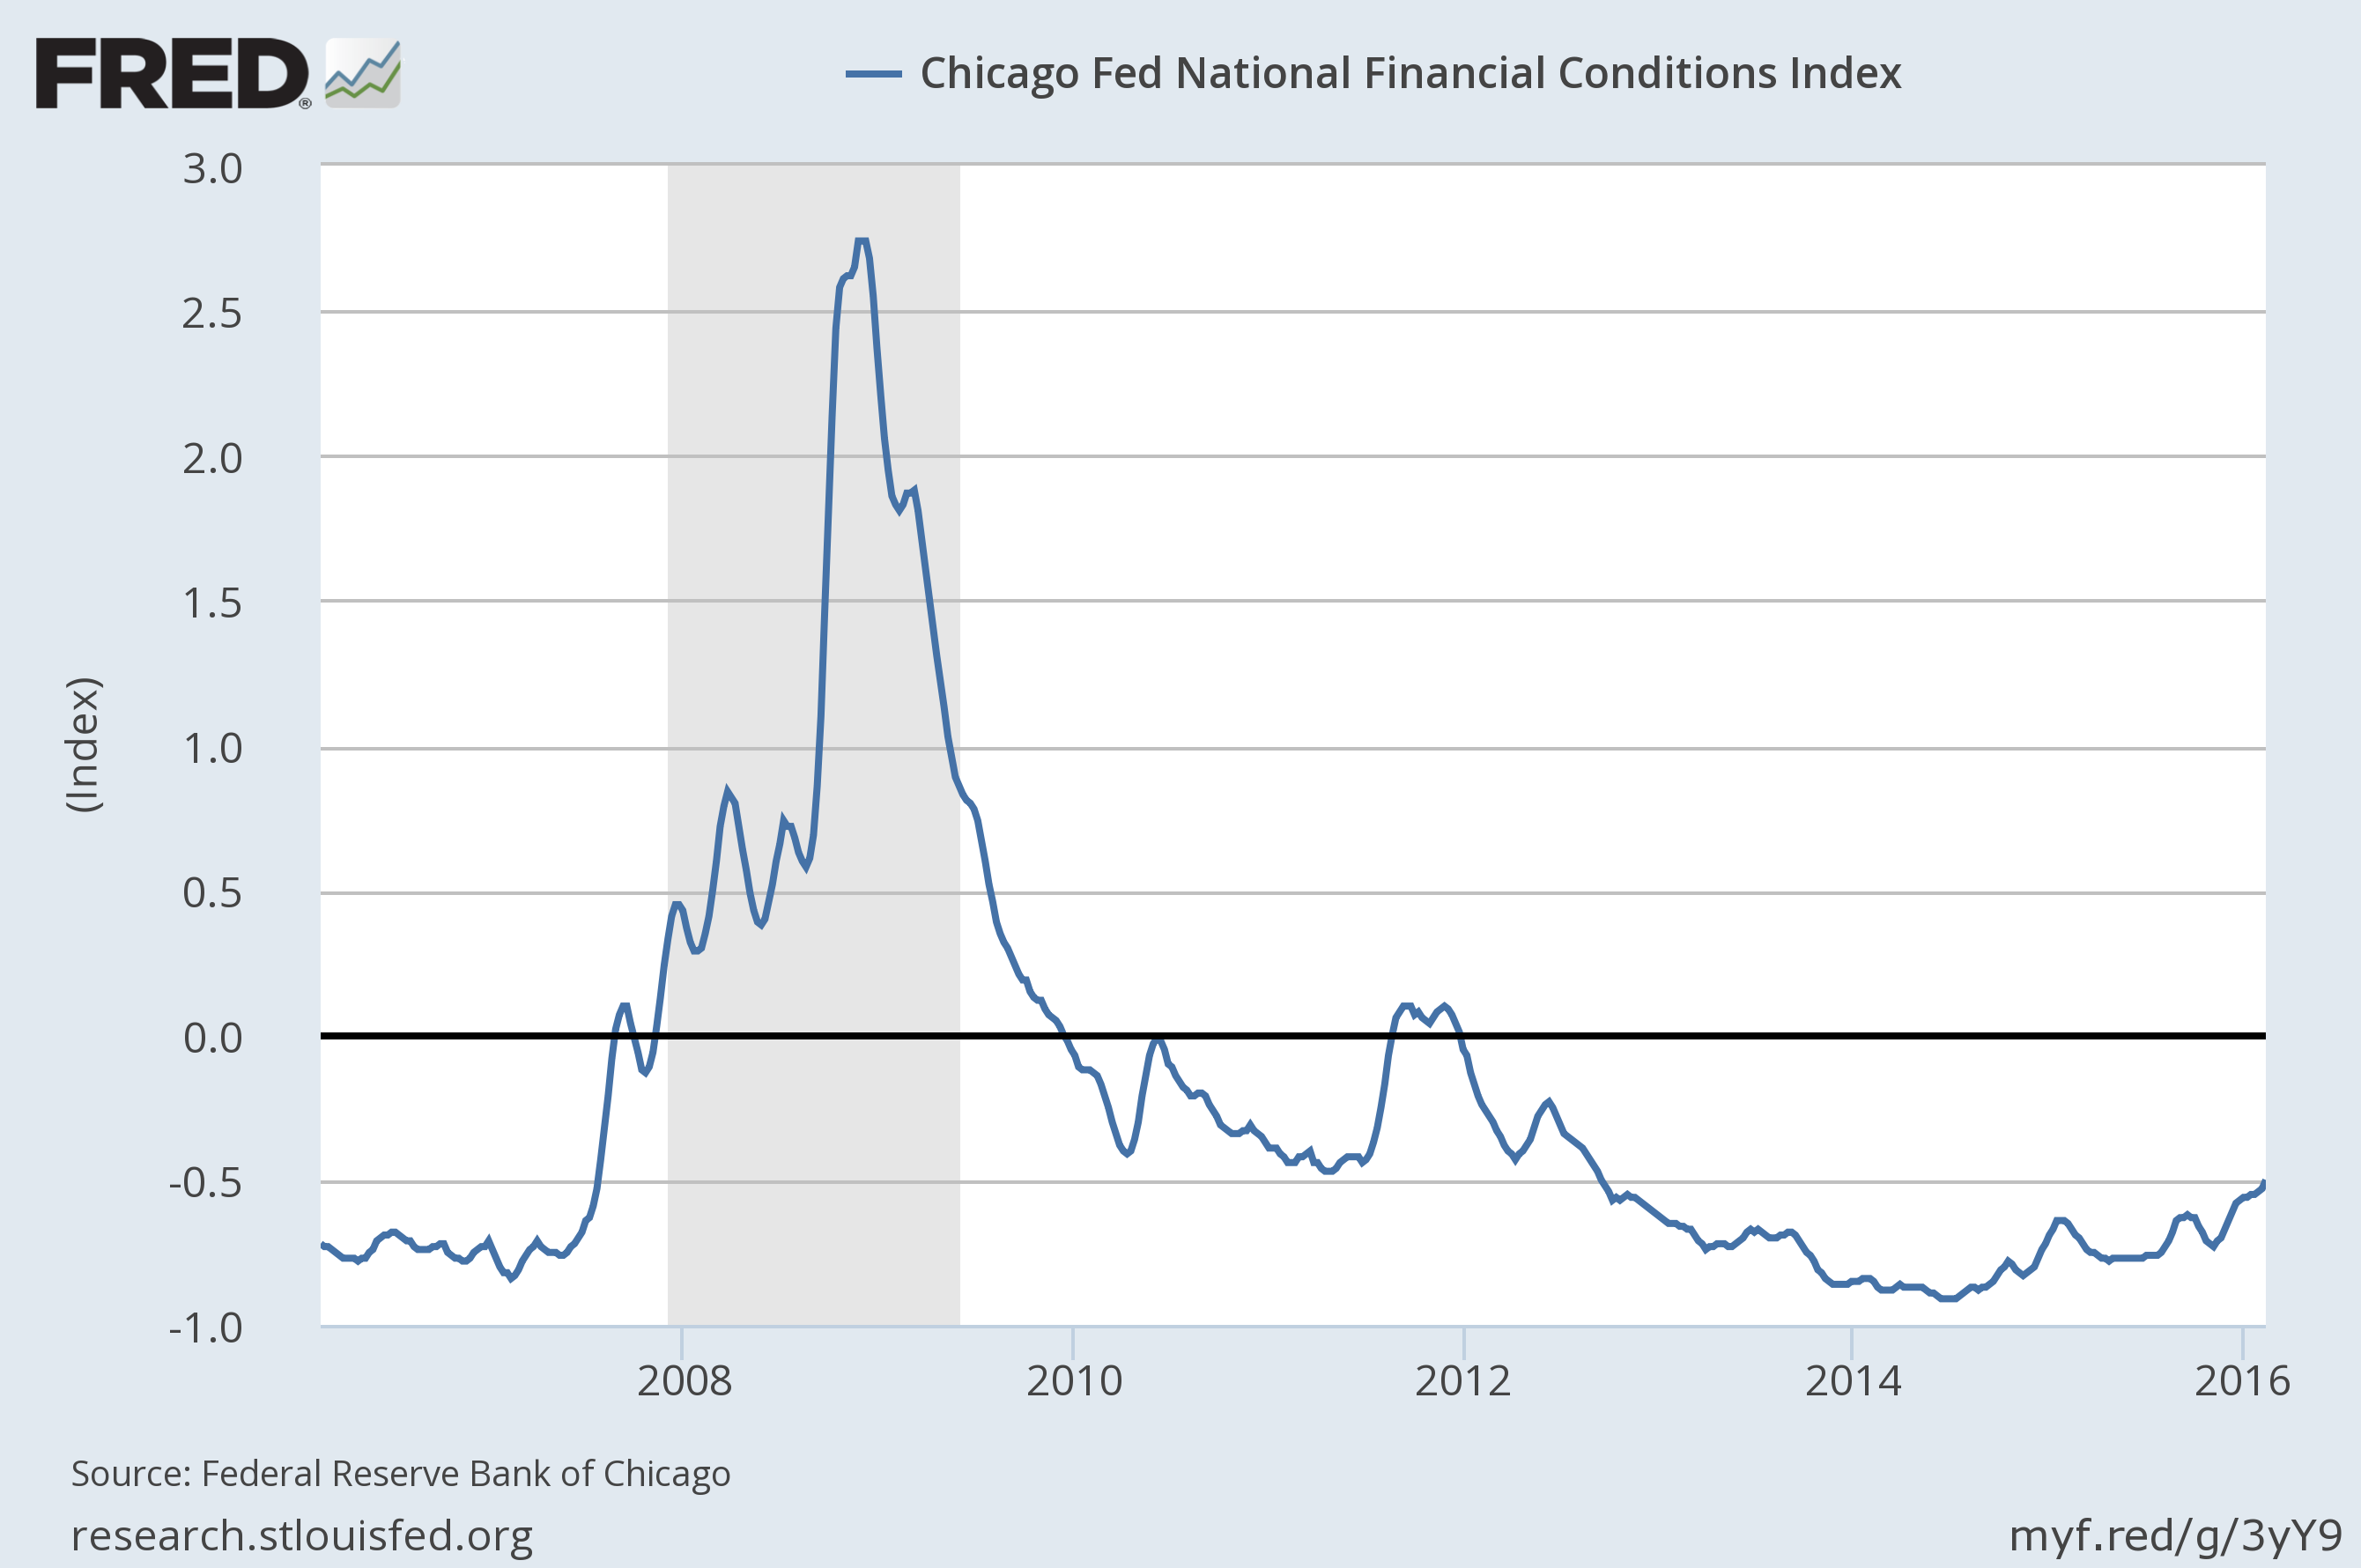
Chicago Fed National Financial Conditions Index: The Chicago Fed’s weekly measure of US financial stress ticked higher again for the week through Feb. 12, reaching -0.50–the highest level in over three years. Despite the relatively elevated reading, the current level still reflects “loose” conditions, as per readings below zero. Only values above zero indicate financial conditions that are tighter than average.
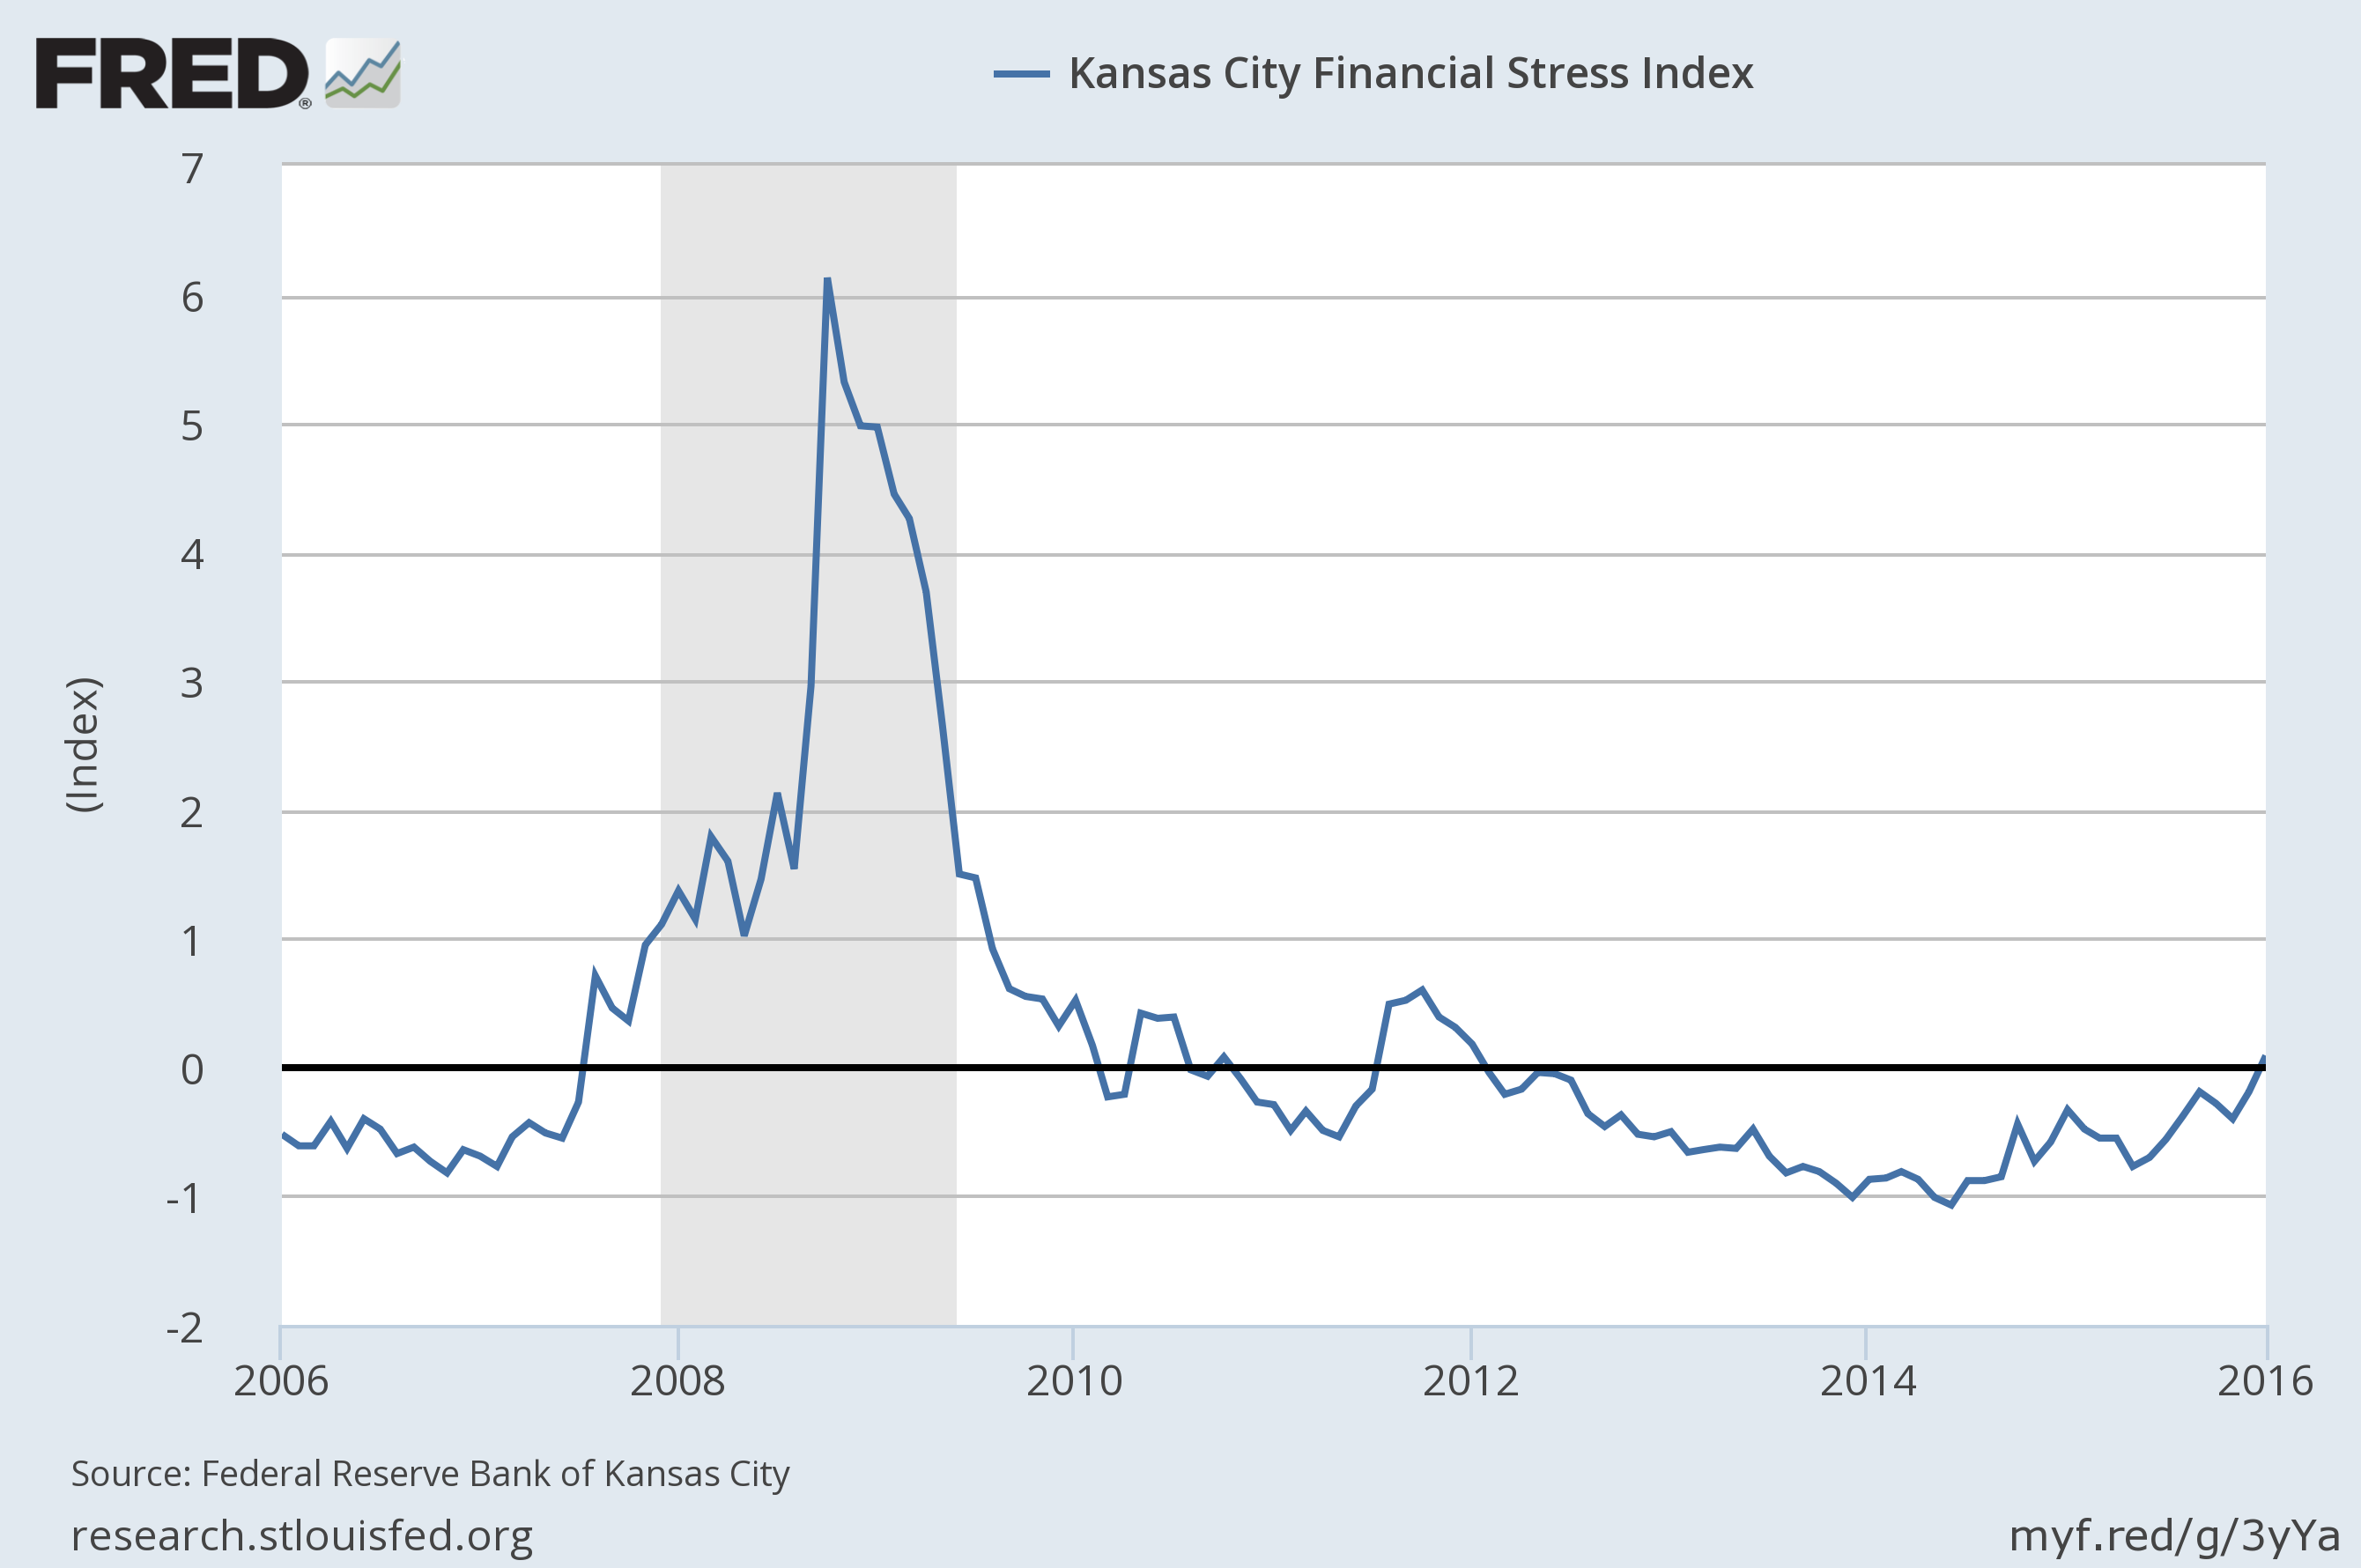
Kansas City Fed US Financial Stress Index: This monthly benchmark of financial stress ticked up in January, close to a four-year high. Reviewing the latest data in context with the last several business cycles, however, suggests that the current reading is still below levels that have previously signaled high risk.
