Mr. Market is becoming anxious… again. Although the US stock market (S&P 500) has recovered all of the lost ground from the recent Aug-Oct correction, several metrics in the Crash Risk Index suite of benchmarks are flashing warning signs. The overall level of danger is still modest and so it’s premature to assume the worst. Nonetheless, risk has recently increased to its highest level since early Oct., when the market was still reeling from worries that China’s slowdown would trigger a global recession.
The Crash Risk Index (CRI)–a 10-factor benchmark that quantifies the potential for a steep and/or sustained US equity market decline—is currently at 0.30 as of yesterday, Dec. 7. That’s the highest level since Oct. 6. In other words, three of CRI’s ten metrics (see this post for details) are dispensing danger signals. History suggests that CRI’s tipping point is 0.5. By that standard, the recent increase is still within the range of “normal” behavior that is generally associated with a positive trend. The question is whether CRI will soon rise above the 0.5 mark? If and when that happens, the outlook for stocks, and the general economic climate, will turn substantially darker.
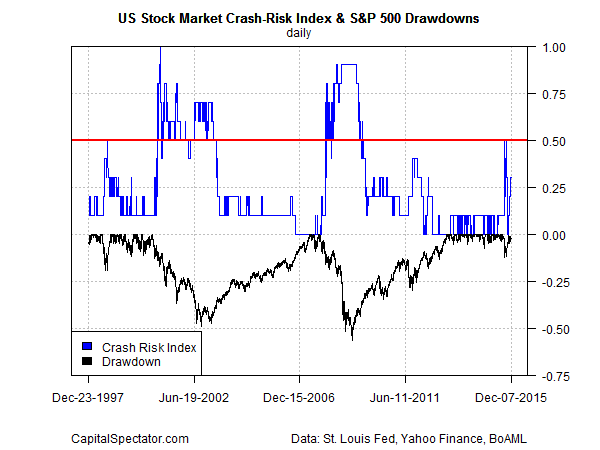
Note that in the previous bout of selling–roughly mid-Aug through early Oct–CRI rose to 0.5 but never crossed the red line, as shown in the chart below. (For a longer-term history of CRI, see the second chart at the end of this post.)

As for the latest increase, CRI’s moderately higher level is due to a fresh set of warnings via three risk metrics:
• Error-adjusted momentum (EAM)
• A quantitative estimate of bear-market risk via a Hidden Markov Model analysis
• Relatively elevated “value” risk, based on an average of 3/4/5-year trailing returns
Keep in mind that the majority of CRI’s indicators currently align with comparatively low risk. That’s no guarantee of a smooth ride, of course, but the fact seven of ten CRI benchmarks are still in positive/bullish territory in varying degrees implies that it’s too early to argue that the jig is up for the bull market in US equities.
Then again, the trailing 5-year return for the S&P 500 is slightly above an annualized 11% total return as of yesterday (Dec. 7). That’s a healthy gain and one that’s above average for the market’s long-run history. Meanwhile, research shows that asset returns have a habit of mean reverting around the trailing 5-year mark. Considering all these factors suggests that it may be timely to reduce US equity risk, particularly if your allocation to this asset class is well above your target range.
Granted, CRI’s risk level is still moderate, which implies that there’s no urgency to reduce US stock market exposure. If CRI rises above 0.5 in the days and weeks ahead, however, we’ll have a stronger case for managing risk allocations down.