This week’s economic news was positive. The leading and coincident indicators point to continued expansion. Retail sales strongly advanced for the second consecutive month while housing starts printed one of their strongest reports in years.
Industrial production, which was unchanged, was the only weak number. But weakness is confined to the oil sector; it hasn’t bled into other sectors. The markets advanced somewhat, although this week’s advance was a bit more contained. High valuations and rising interest rates will probably contain further advances in the next few weeks.
On Friday, the Conference Board released the latest leading and coincident indicators. The LEIs rose .1%. Their 6-month rolling averaged decreased from 1.1 to .7%. 6 of 10 components increased. The CEIs also rose .1%, while increasing .8% on a rolling 6-month basis. All 4 components increased. In the Conference Board’s Judgement,
the current behavior of the composite indexes suggests that the expansion in economic activity will continue into the early months of 2017.
The Census Bureau reported that retail sales increased .8% M/M in October after rising a solid 1% the previous month.
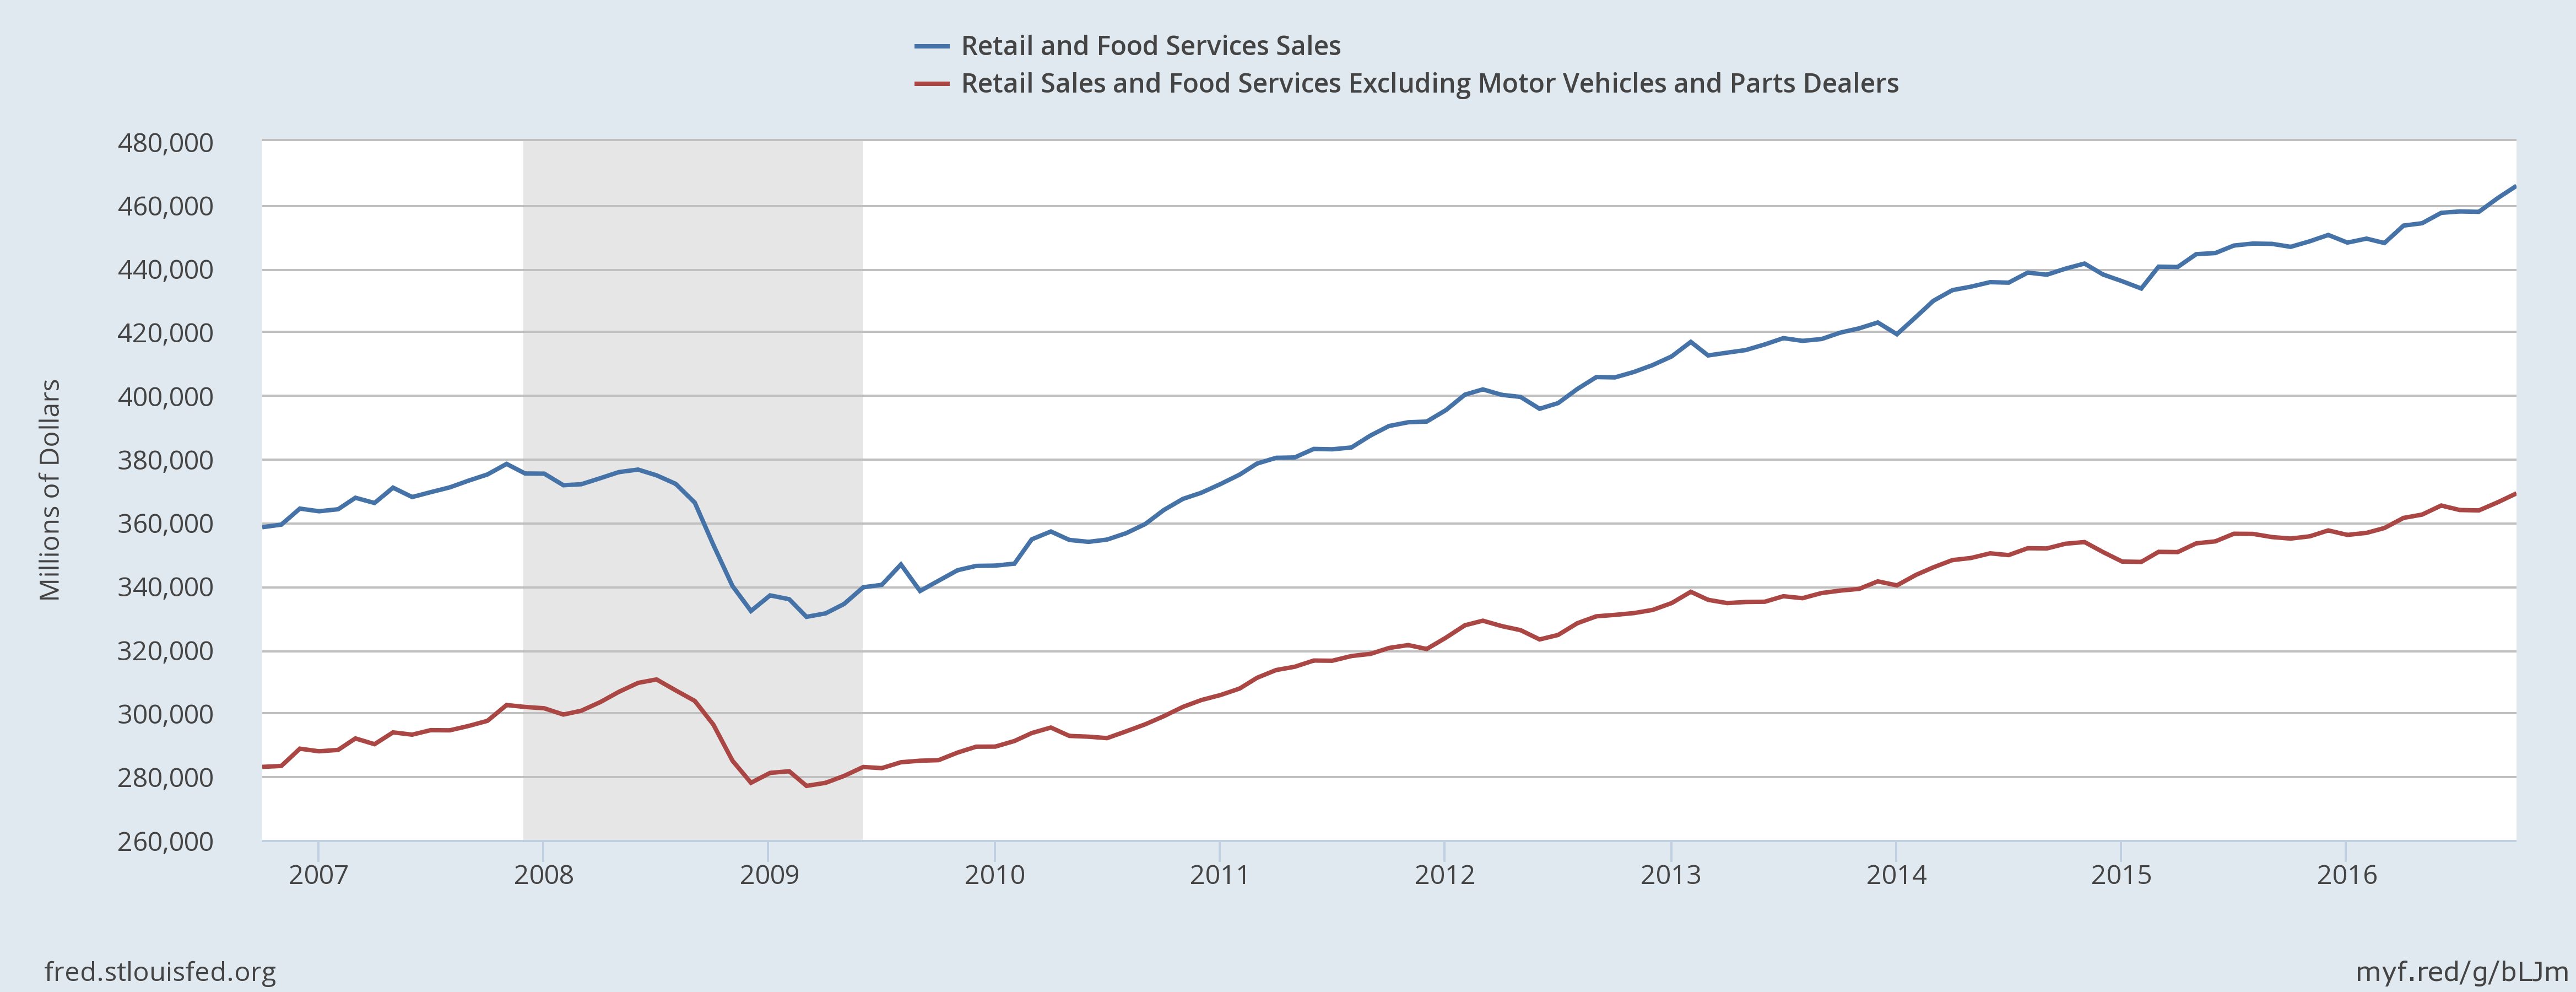
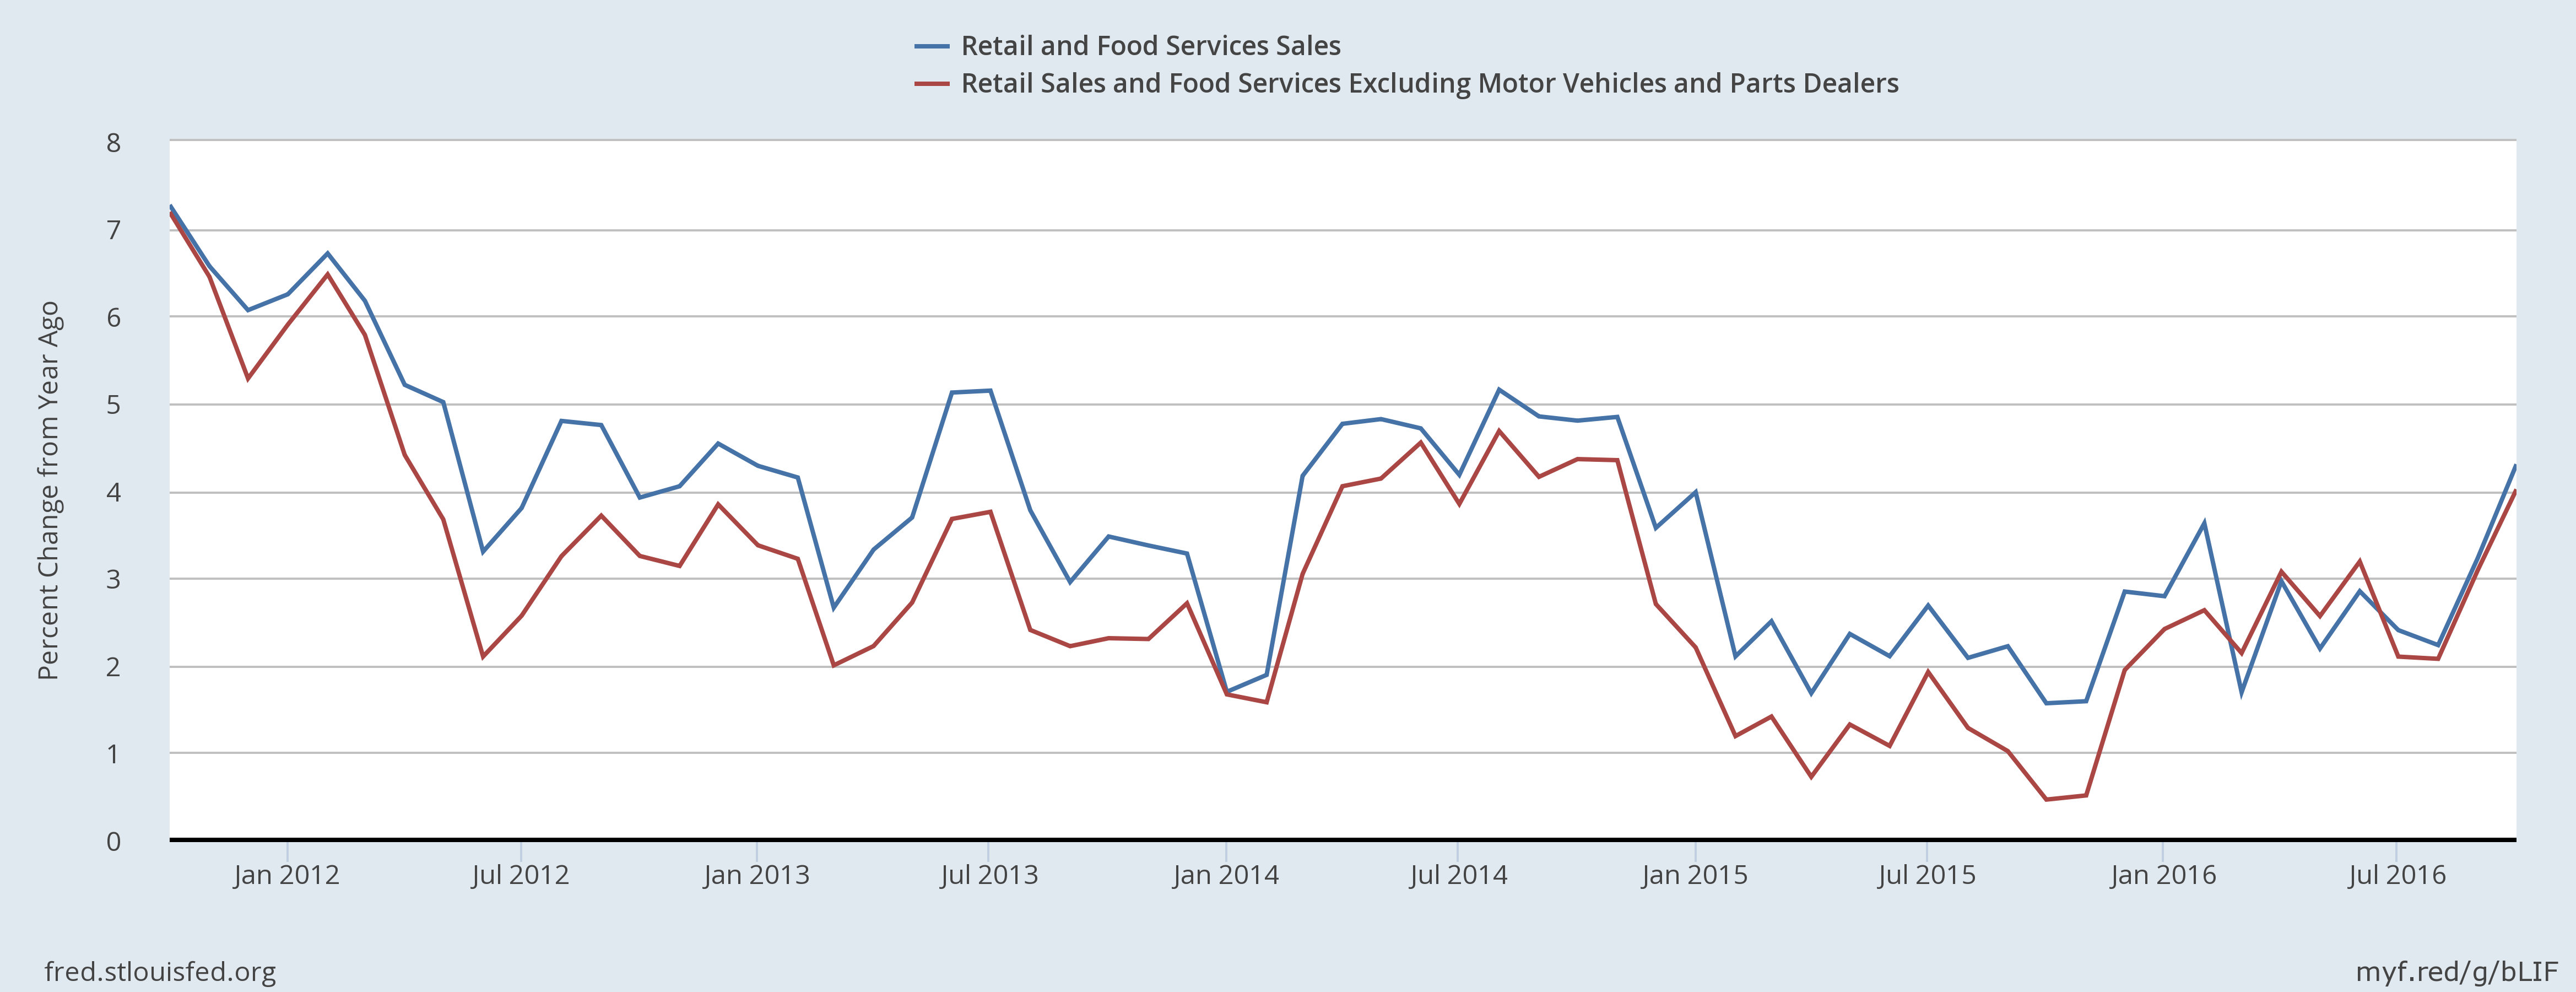
The top chart shows total real retail sales and retail sales ex-auto; both data sets show a continual increase since the beginning of the recession. The bottom charts shows each’s Y/Y percentage change, which increased to a very healthy 4% annual rate.
This week’s housing news was especially strong. Building permits increased .3% M/M and 4.6% Y/Y. While permits for 1-unit structures increased 2.7% (below in blue) a 22.2% drop in multiple unit permits (below in red) kept total growth weak. The following chart graphs these figures:
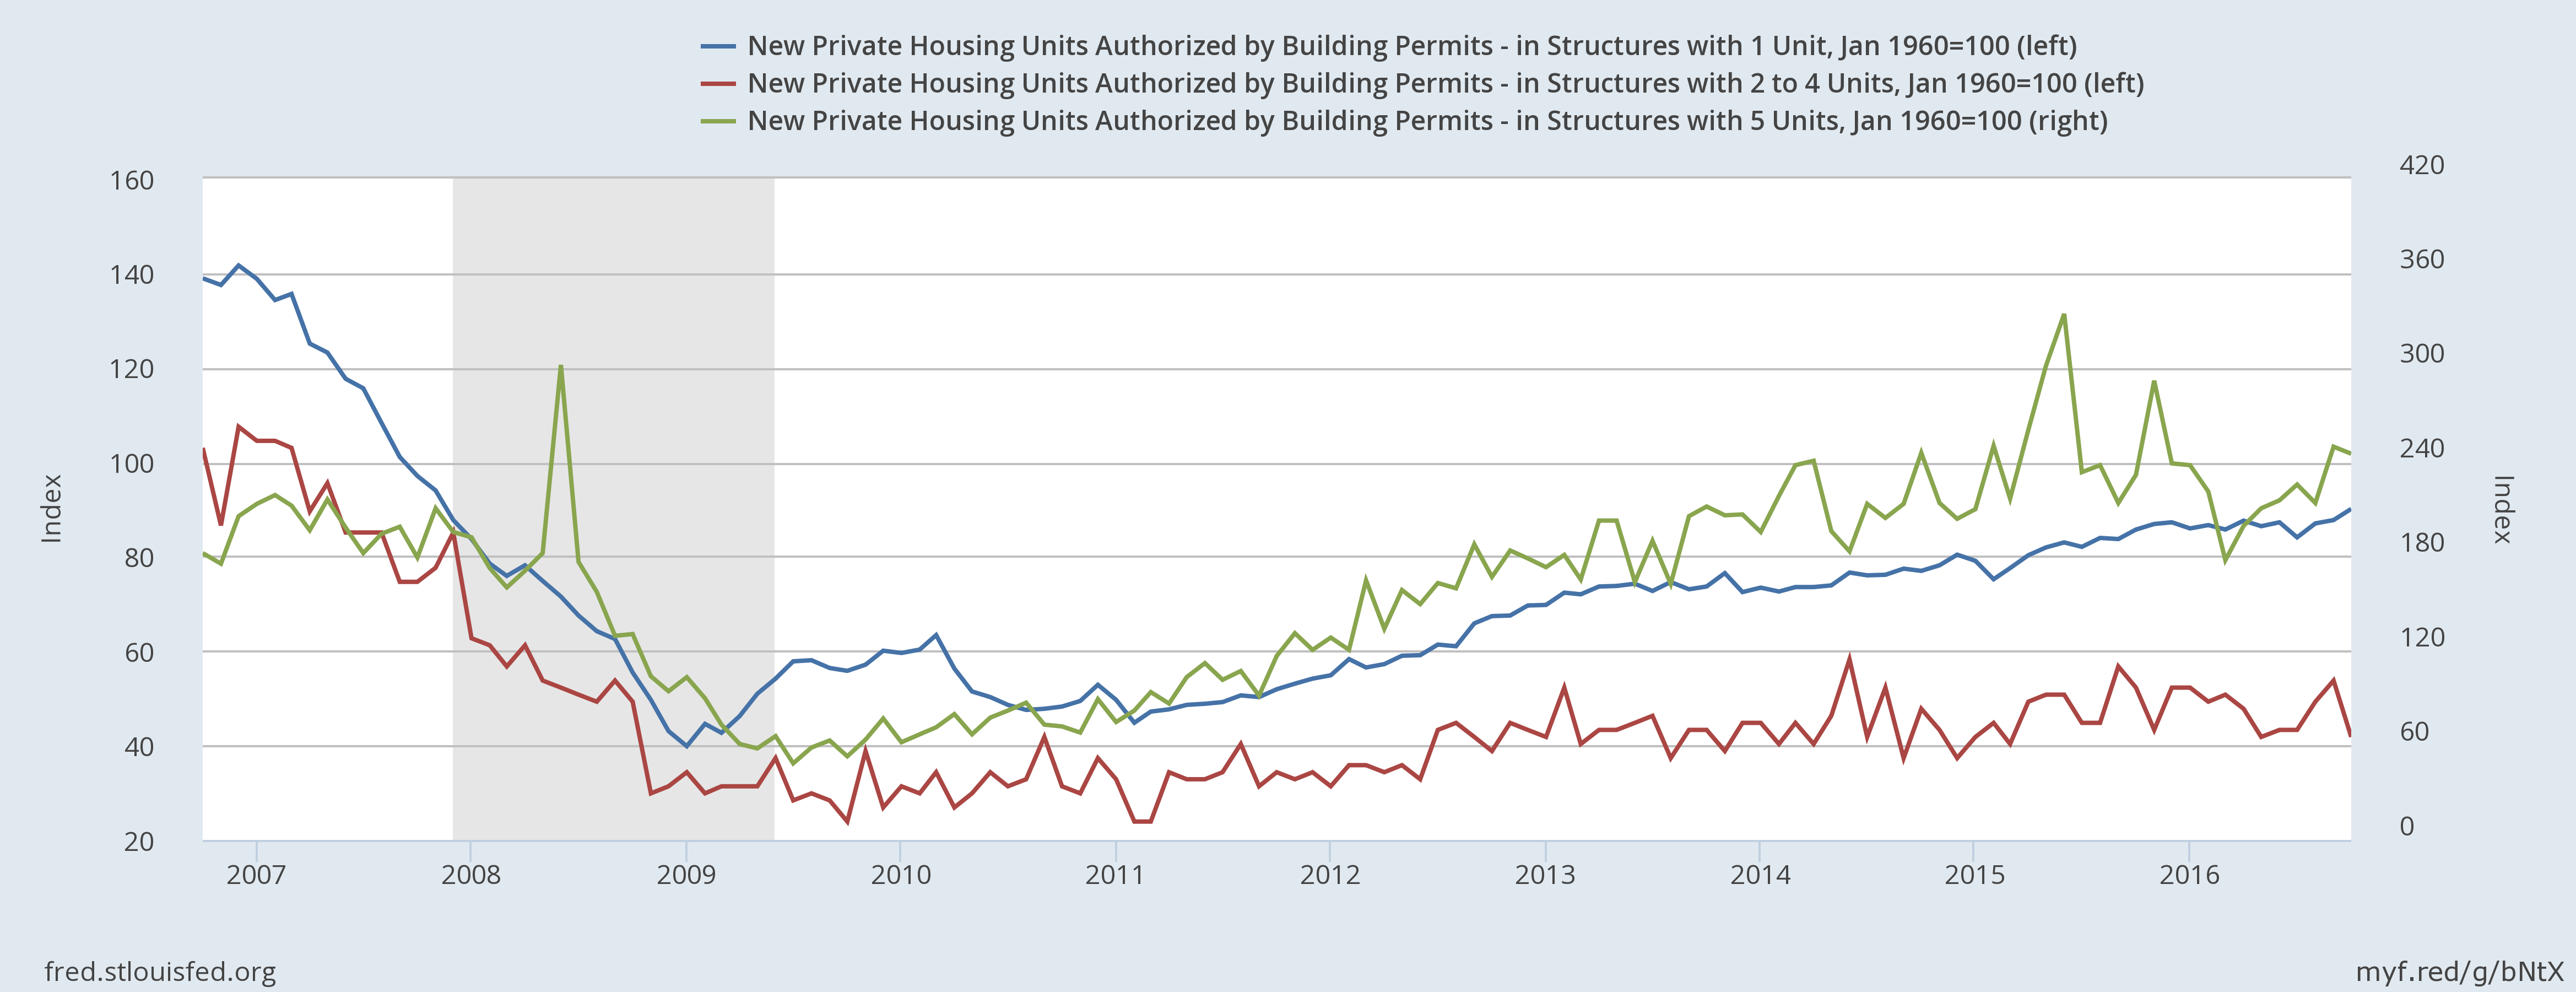
But housing starts provided the best news: they increased 25.5% M/M and 23.3% Y/Y. A huge increased in 5+ unit starts (in green below) along with a 10% increase in 1-unit structures (in red below) all contributed to this number:
The only negative news came from the Federal Reserve, which reported that industrial production was unchanged last month after falling .2% in September.
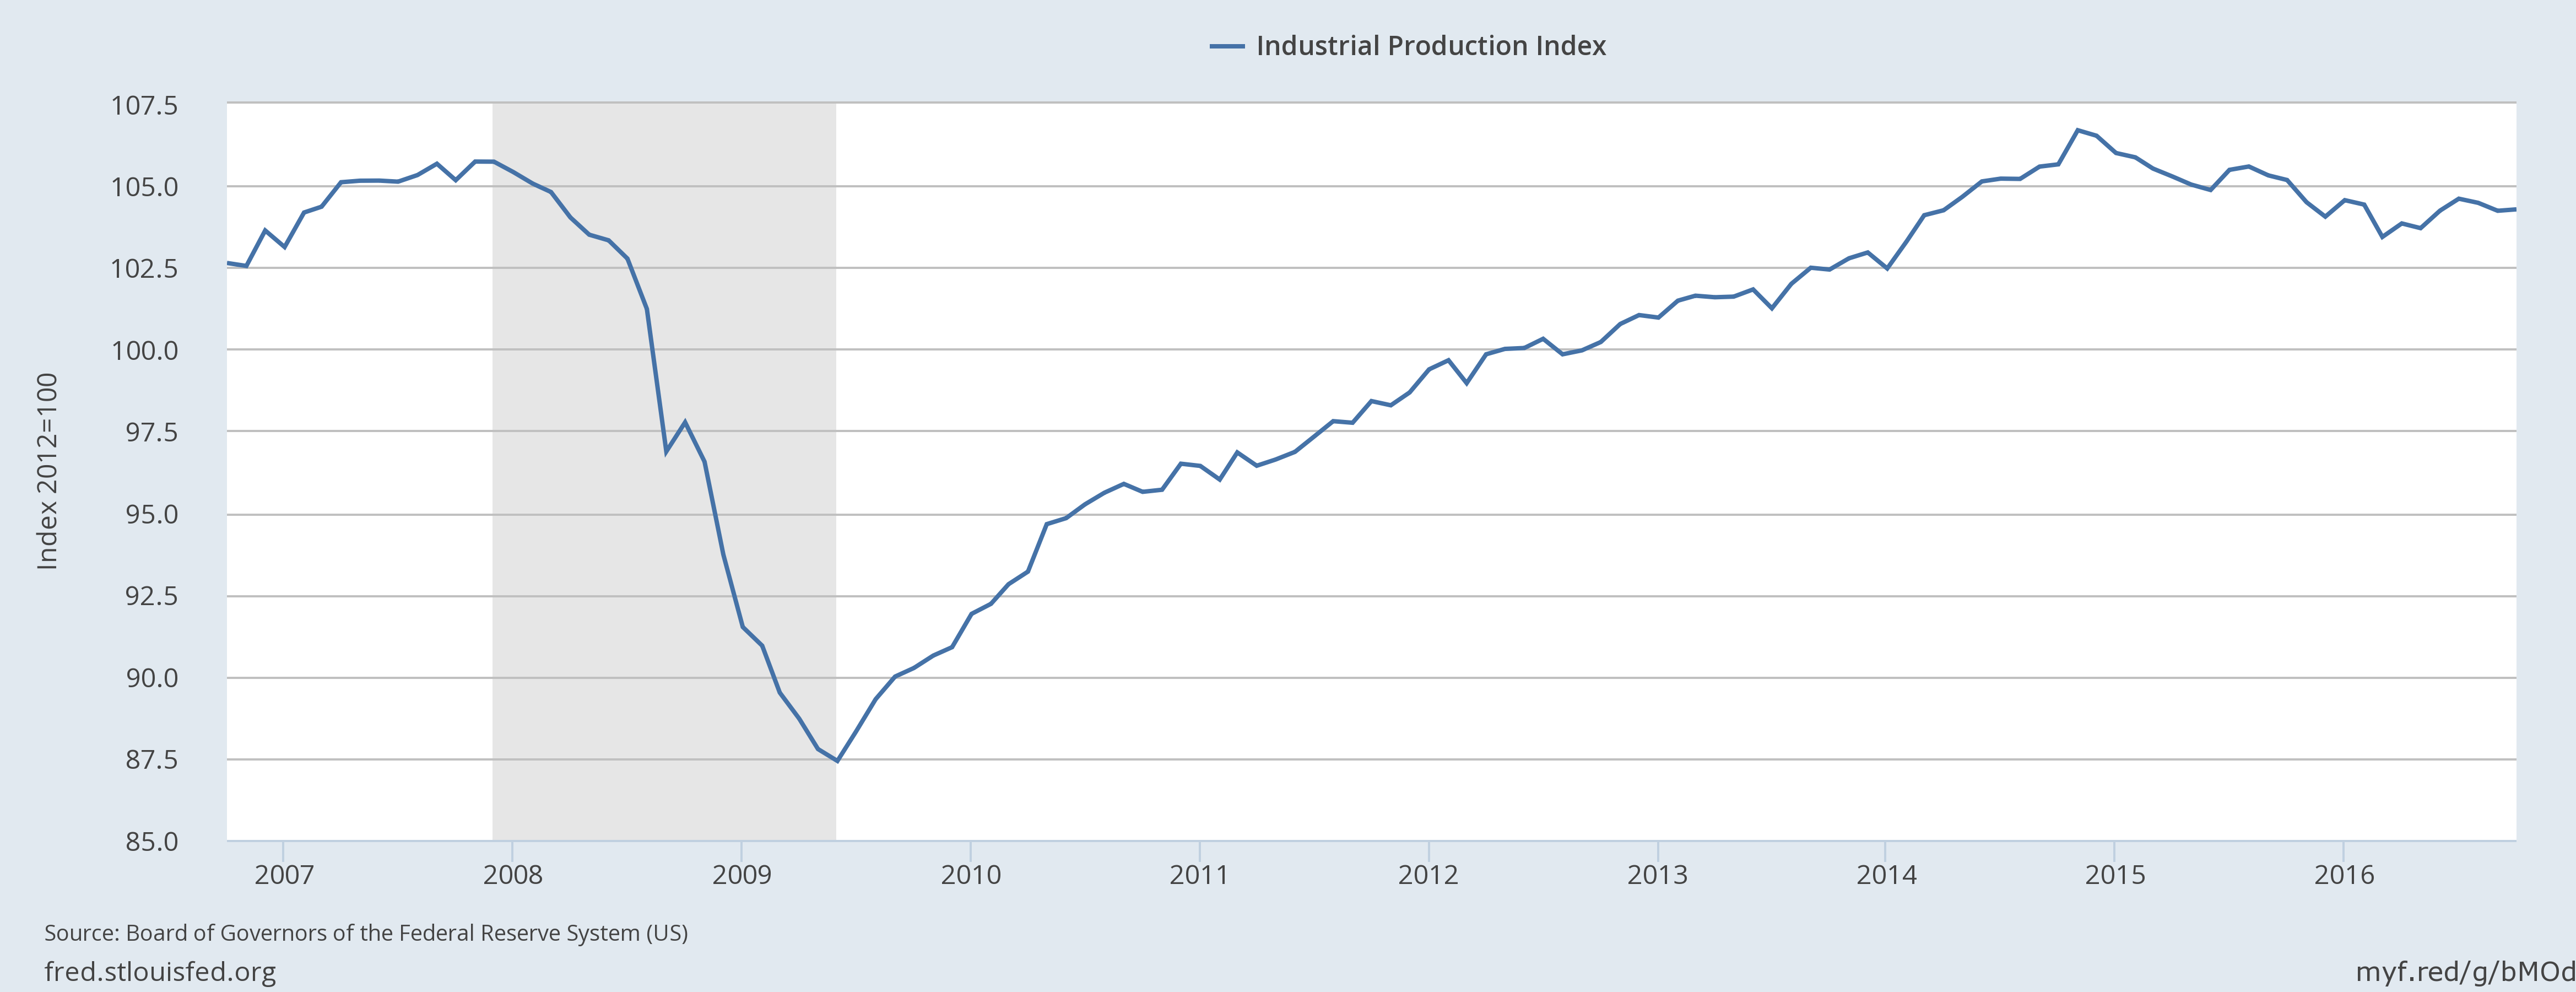
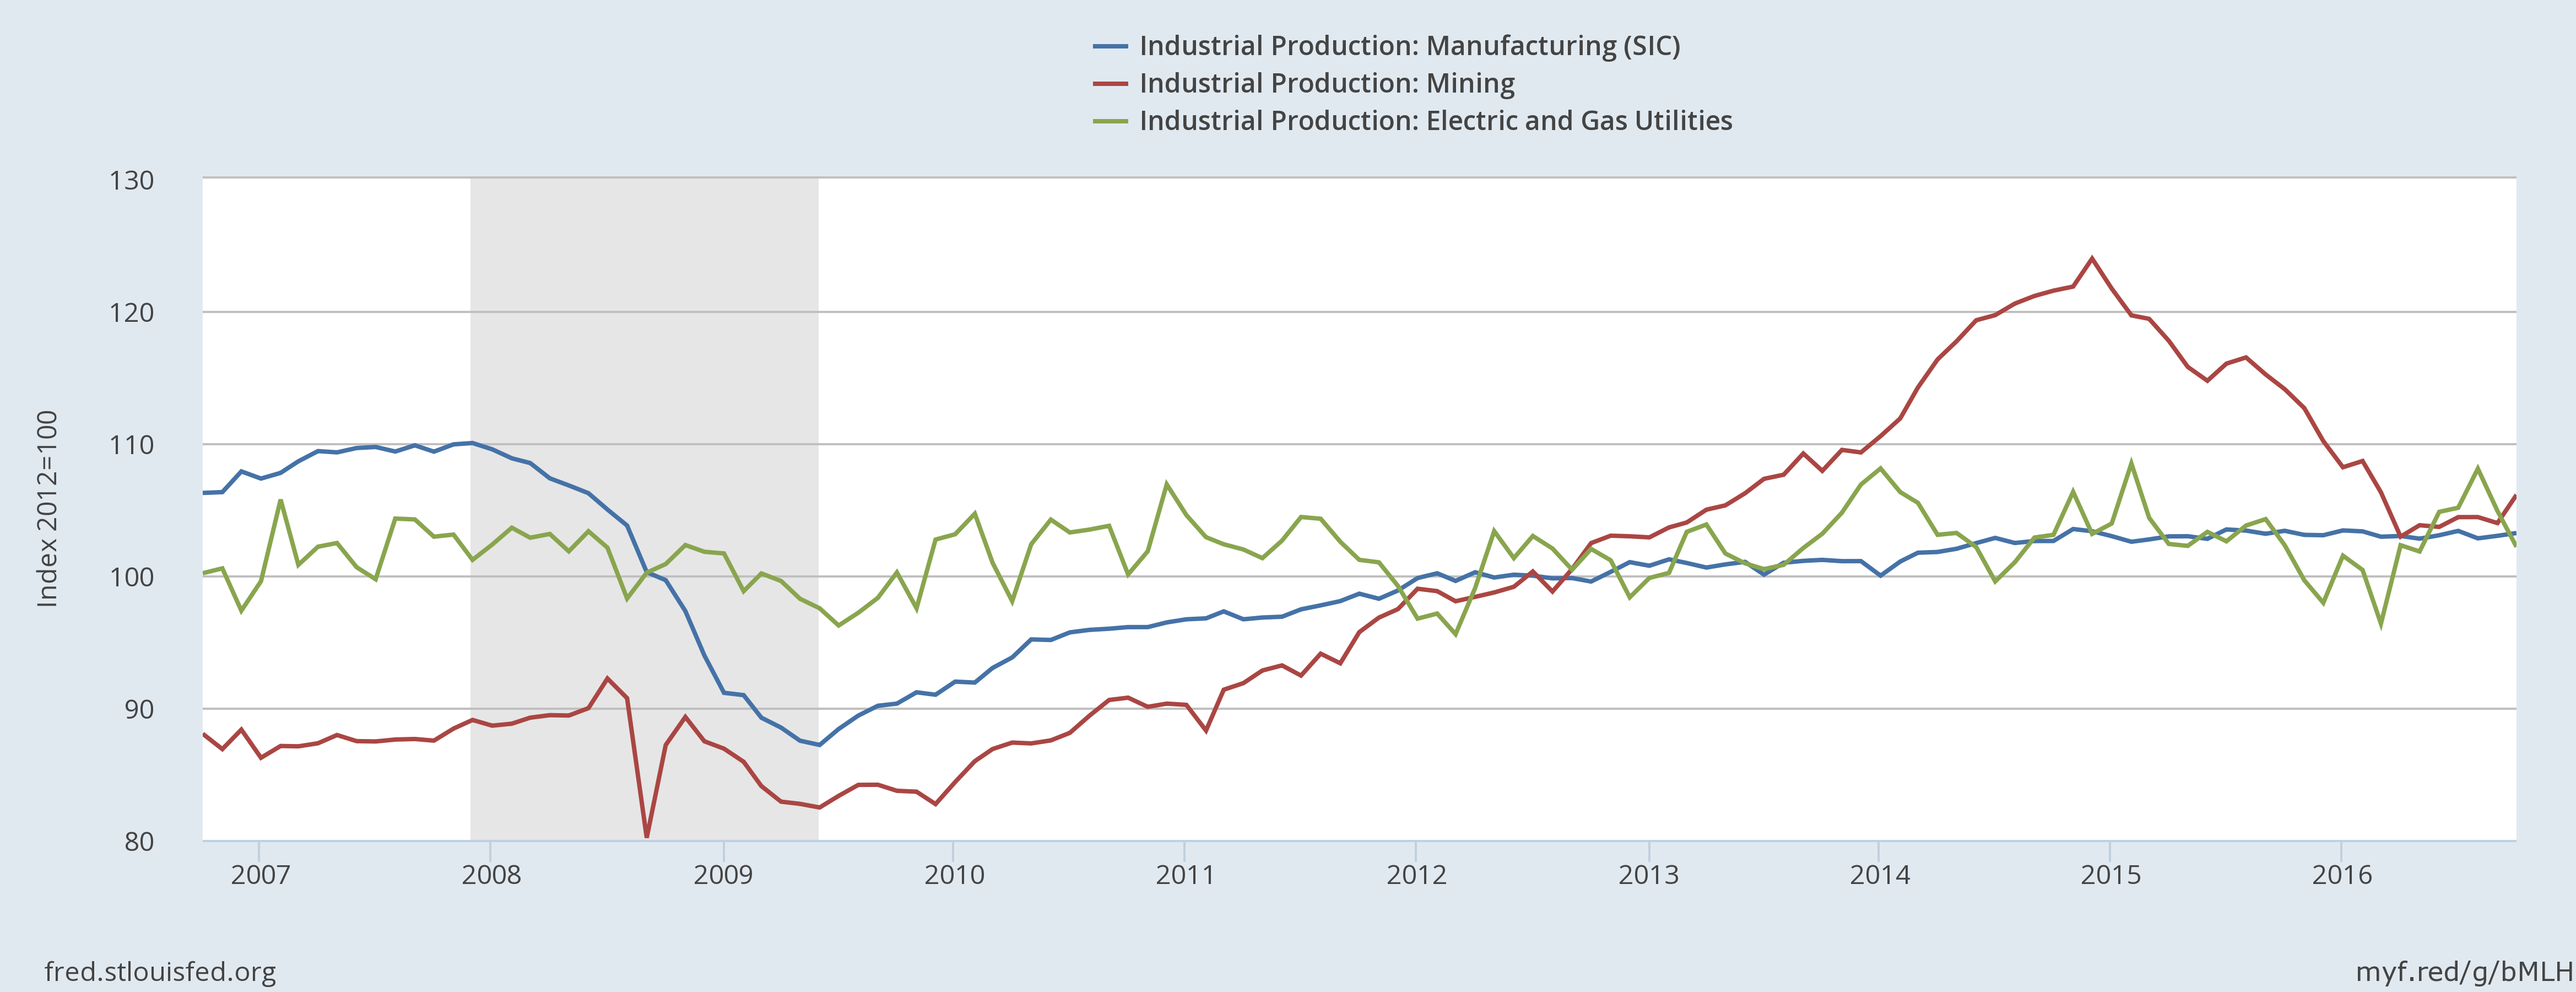
The top chart shows overall industrial production, which has been decreasing since the beginning of 2015. The bottom chart shows that mining (read: oil extraction) is the primary reason for the decline. Mining output increased between 2010 and 2015, but has consistently declined since. At the same time, utility (green) and manufacturing output (red) moved sideways.
The Atlanta Fed’s GDP Now currently predicts 4Q GDP of 3.6%; the NY Fed’s Nowcast is slightly lower, projecting growth of 2.4%.
Economic Conclusion: this week’s news was positive. The LEIs and CEIs point to continued growth. Retail Sales – a coincident indicator – strongly increased for the second consecutive month while housing reported outright bullish numbers. Only industrial production was negative, but only one subsector (mining) is responsible for the decline.
Markets overview: the market are expensive; the current/forward PE for the SPYs (NYSE:SPY) and QQQ (NASDAQ:QQQ) are 24.19/23.75 and 18.25/19.12, respectively. The latest quarter of earnings news was positive for the markets. From Zacks:
We now have Q3 results from 470 S&P 500 members or 94% of the index’s total membership. Total earnings for these 470 index members are up +3.8% from the same period last year on +2.6% higher revenues, with 73.2% beating EPS estimates and 55.3% coming ahead of top-line expectations.
While this bodes well for future share appreciation, it appears the recent rally may have run its course:
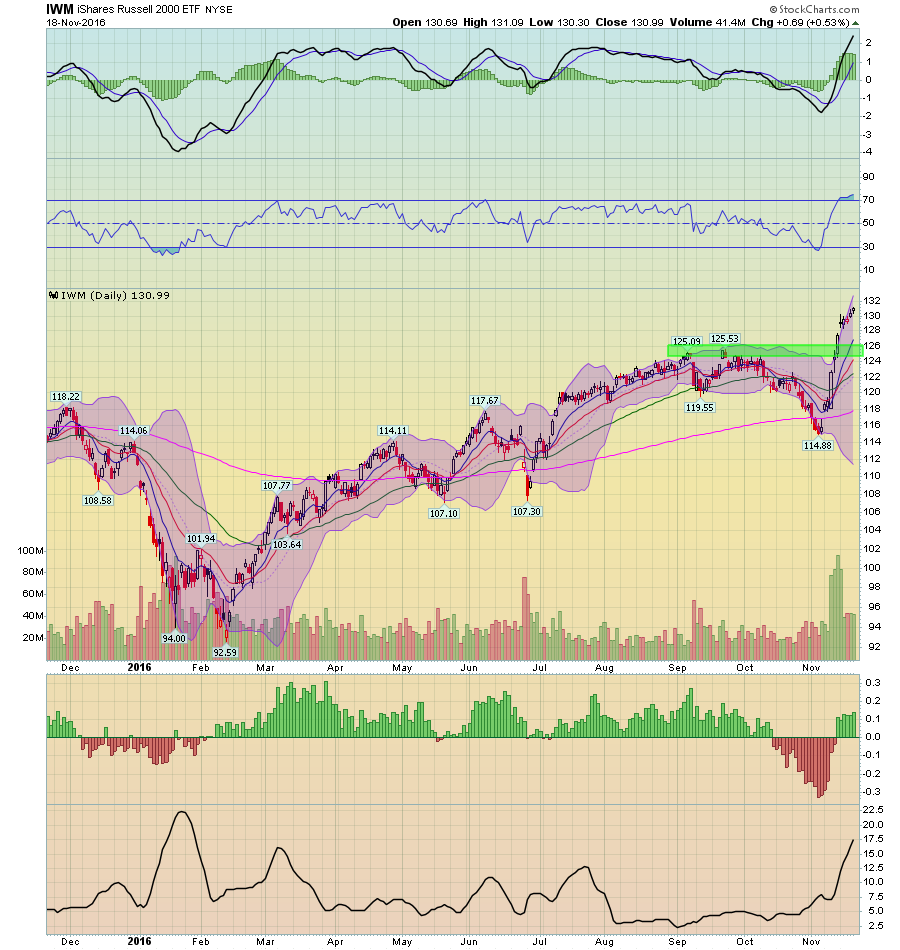
The IWMs (NYSE:IWM) – which have led the rally due to their being more exposed to the domestic economy -- have rallied through resistance; now the MACD is spiking, indicating the rally may be moving into over-extended territory. While the IWMs and QQQs potentially have room to move higher, the, it’s doubtful we’ll see a strong advanced propelled by these averages. The central thesis to Trump’s economic policy is “America first;” this means large, multi-nationals may face a more difficult trade environment; this makes small caps more attractive.
