
The dollar outperformed every other G10 currency, while major global stock indices slid, as fears over a second wave of global coronavirus infections increased. This may have been due to another acceleration in infected cases, with the daily number getting closer to its record high, hit on Friday.
FEARS OVER A SECOND CORONAVIRUS WAVE INCREASE
The US dollar traded higher against all the other G10 currencies on Wednesday and during the Asian morning Thursday. It most outperformed NOK, AUD, and SEK in that order, while it eked out the least gains versus CHF and JPY.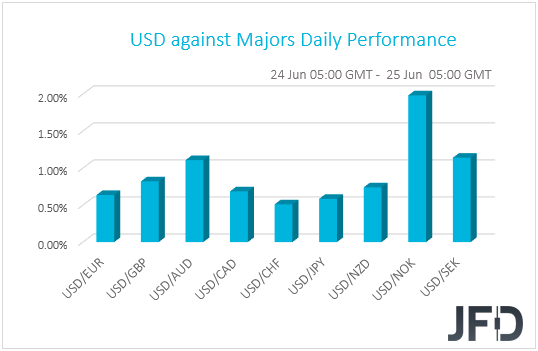
The dollar, the franc, and the yen were the main winners, which combined with the fact that the Aussie was among the main losers, suggests that trading switched to risk-off yesterday. Indeed, major EU and US stock indices were a sea of red yesterday, with the negative investor morale rolling into the Asian session today. Both Japan’s Nikkei 225 and South Korea’s KOSPI slid 1.18% and 1.90% respectively. China’s and Hong Kong’s markets were closed for a holiday.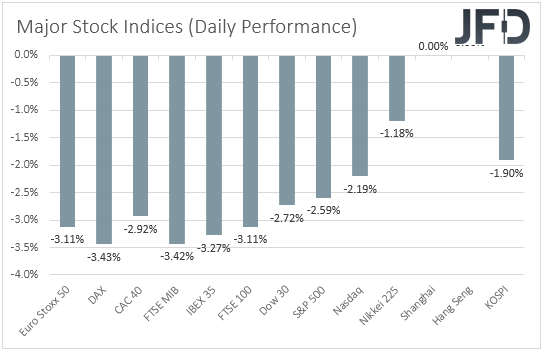
It seems that those who bet on a quick economic recovery due to the loosening of the coronavirus-related restrictions around the globe have taken a step back, allowing those who are concerned over a second wave of global infections to take charge. This may have been due to another acceleration in infected cases, with the daily number getting closer to its record high, hit on Friday. Three US states reported record increases, while governors of New York, New Jersey, and Connecticut, ordered travelers from nine other states to quarantine for 2 weeks on arrival. On top of that, what may have added to fears was the fact that the IMF (International Monetary Fund) downgraded its projections with regards to a global economic contraction this year. It now expects global output to shrink 4.9%, instead of 3.0% as forecast in April. Headlines that the US is considering USD 3.1bn worth in new tariffs on products from France, Germany, the UK, and Spain, may have also weighed on the broader market sentiment.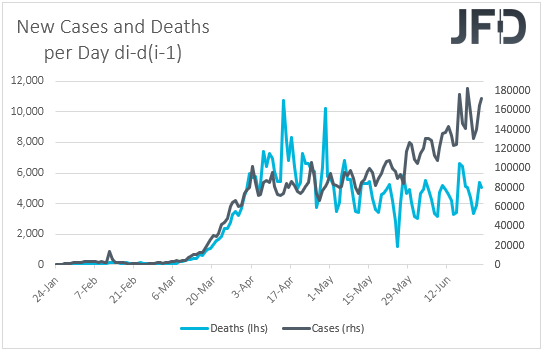
As for our view, although we still see decent chances for sentiment to improve as most nations around the globe continue to loosen lockdown measures, the increasing fears over a second virus wave and the technical picture in several stock indices and other sentiment gauges, like AUD/USD and AUD/JPY, make us step back to the sidelines for now. Despite Nasdaq hitting a fresh record high on Tuesday before retreating yesterday, several other indices, like the Dow, have formed a lower high, while currency pairs that track the broader investor morale point to indecisive activity through consolidative patterns. With all that in mind, we prefer to wait for clearer signals that the latest risk recovery is set to continue, while in order to start considering the bearish case again, we would like to see more lockdown measures being re-introduced worldwide, something that could result in a second hit to the global economy.
DJIA – TECHNICAL OUTLOOK
The DJIA index took a strong hit yesterday, loosing around 700 points. The price is now trading below a short-term tentative downside resistance line taken from the high of June 9th. However, DJIA still remains above its short-term upside support line taken from the low of April 2nd, which may help keep the bulls in the field for a while. For now, we will take a neutral stance and wait for one of those lines to get violated, before examining the next directional move.
If the aforementioned downside line gets broken and the price rises above the 26420 barrier, marked by the current highest point of this week, that may clear the way to some higher areas again. The DJIA could accelerate to the 26791 obstacle, a break of which might set the stage for a re-visit of the current highest point of June, at 27631.
On the other hand, if the previously-discussed upside line fails to provide support and breaks, that could start ringing alarm bells in the bull-block, especially if the index slides below the 24560 hurdle, marked by the current lowest point of June. Such a move may clear the way towards the 24155 obstacle, which if broken could set the stage for a drop to the 23325 level, marked by the lows of May 4th and 15th.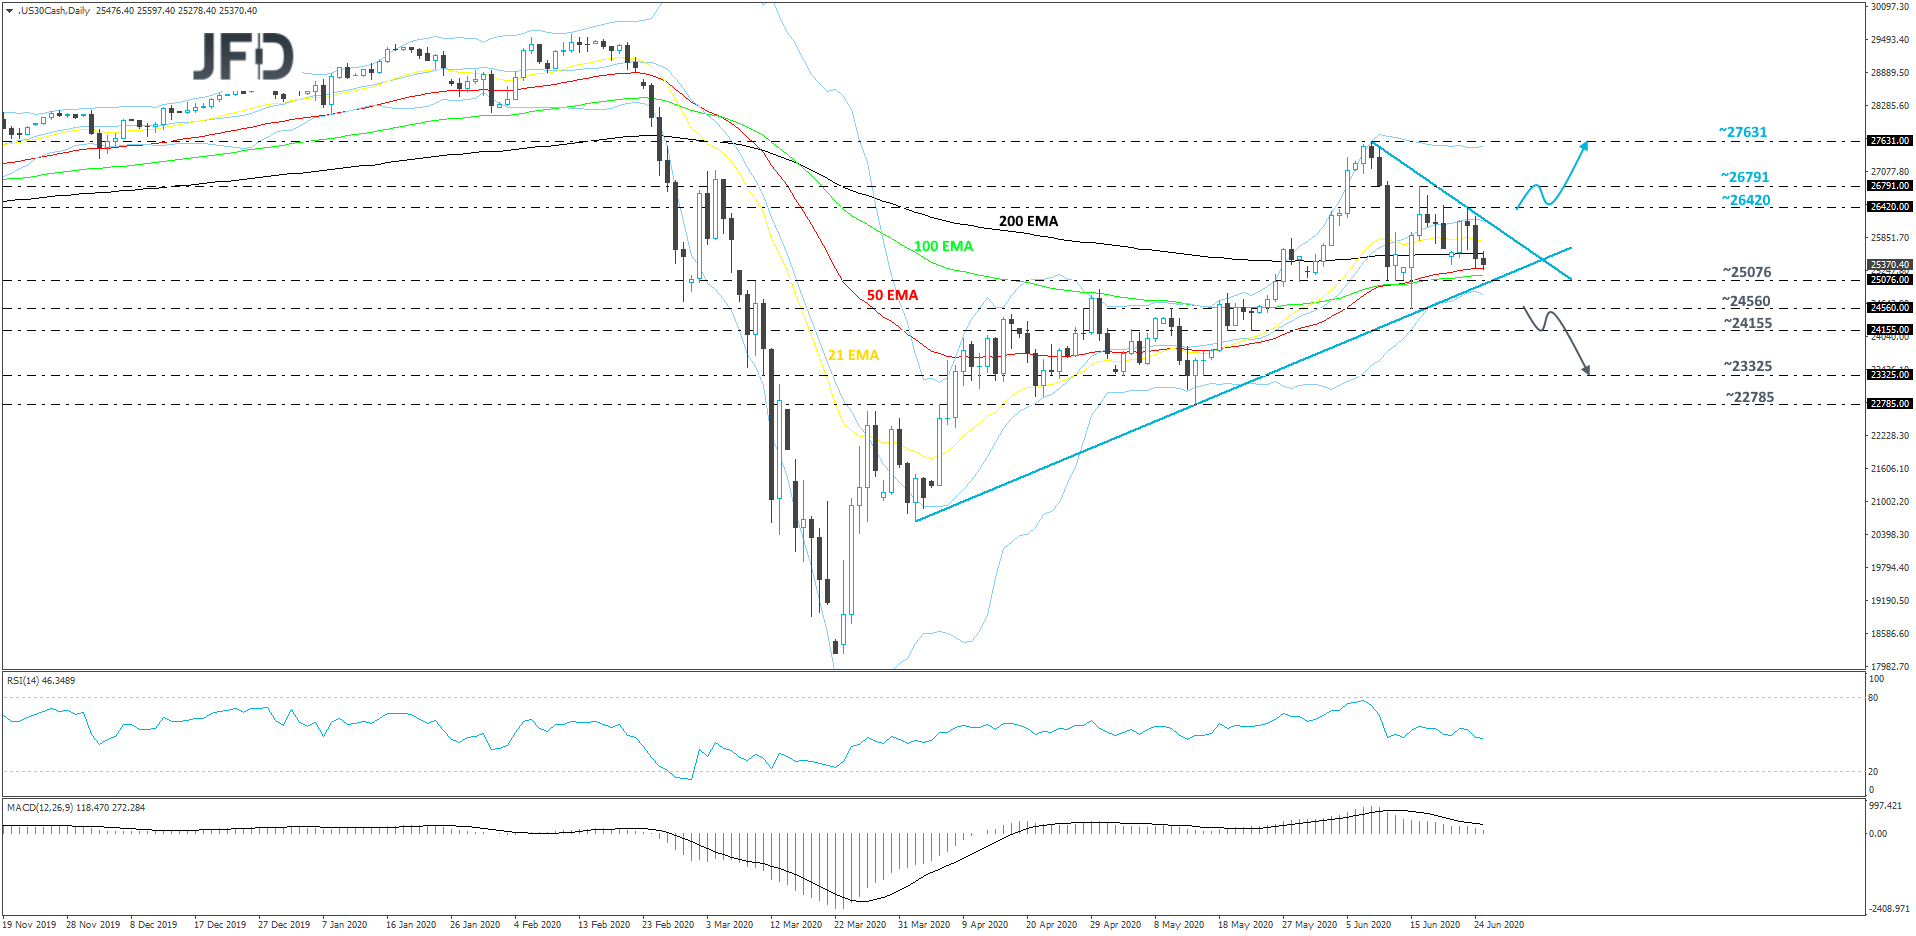
AUD/USD – TECHNICAL OUTLOOK
Looking at the technical picture of AUD/USD on our 4-hour chart, the pair seems to be forming somewhat of an ascending triangle. The rate has declined in the past couple of days, however, if it moves lower, but if it struggles to break that upside support line taken from the low of June 15th, which is also the lower side of the above-mentioned triangle, that may help the buyers get back into action. There is a possibility to see some more upside, but for now we will only aim for higher levels within that ascending triangle pattern.
A move lower and a failure to break the aforementioned upside line could result in the bulls running back into the field and pushing the rate up again. We will first aim for the 0.6893 obstacle, a break of which might open the way towards the 0.6976 resistance level, marked near the highs of June 16th and 23rd. That level is also the upper side of the aforementioned ascending triangle.
On the downside, if the above-discussed upside line breaks and the rate falls below the 0.6810 hurdle, marked by the low of June 21st, that may attract more sellers, as the pair would confirm a forthcoming lower low. AUD/USD could then drift towards the low of June 15th, at 0.6776, which may provide some support. If the rate manages to rebound from it, that could make the bulls a bit happier. That said, a failure to push back above the aforementioned upside line, might lead to another round of selling. If this time the 0.6776 zone gets violated and AUD/USD moves further south, the next possible support area could be seen near the 0.6715 level, marked by an intraday swing low of June 1st.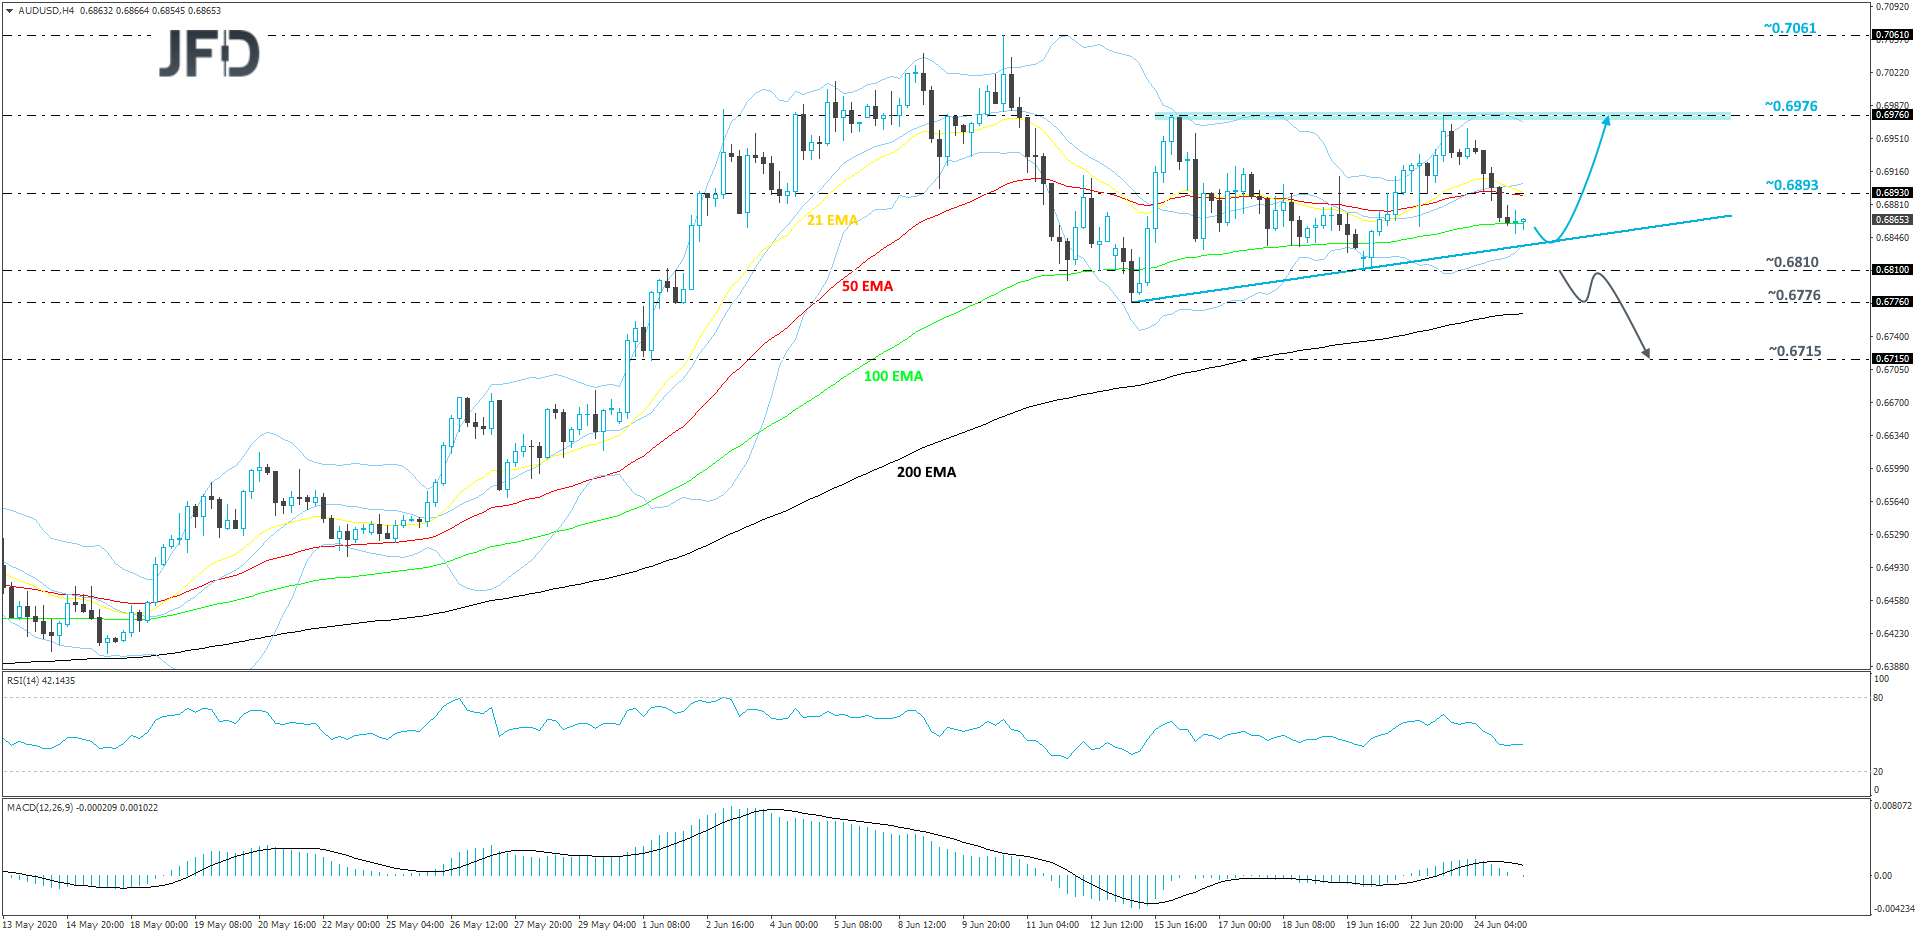
AS FOR TODAY’S EVENTS
During the European morning, we get the minutes from the latest ECB meeting, where officials decided to increase their pandemic emergency purchase program (PEPP) to a total of EUR 1350bn, and remained willing to adjust all of their instruments as appropriate. We will dig into the minutes for discussions over the economic outlook and how likely another stimulus expansion is.
Later in the day, the final US GDP for Q1 is coming out, and it is expected to confirm its second estimate, namely that the US economy contracted 5.0% qoq SAAR. Even if we get a small revision, we expect this release to pass unnoticed as we already have models suggesting how the economy has been performing during Q2. The Atlanta Fed GDPNow model suggests that in the second quarter, the economy slumped 45.5%, while the New York Nowcast points to a –19.0% rate.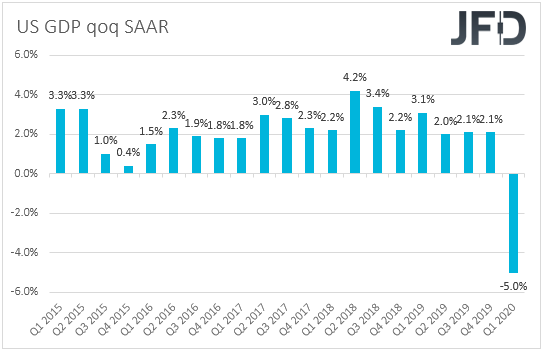
At its latest gathering, the FOMC kept interest rates unchanged and noted that they will continue to increase purchases of bonds and mortgage-backed securities “at least at the current pace”, something suggesting that purchases can accelerate again if deemed necessary. What’s more, last week, they announced tweaks to their bond purchases, widening the range of eligible assets to include all US corporate bonds. Thus, such growth rates may increase the chances for the Fed to do more. After all, when testifying before Congress, Fed Chair Powell himself said that there is “a reasonable probability” that more policy support would be needed.
Durable goods orders for May and initial jobless claims for last week are also coming out. Headline orders are expected to rebound 10.6% mom after a 17.7% slide in April, while the core rate is expected to have risen to +2.1% mom from -7.7%. Initial jobless claims are expected to have slowed to 1.3mn from 1.51mn the week before.
As for tonight, during the Asian morning Friday, Japan’s Tokyo CPIs for June are due to be released. No forecast is available for the headline rate, while the core one is anticipated to have held steady at +0.2% YoY.
We also have 5 speakers on today’s agenda: ECB Executive Board members Isabel Schnabel and Yves Mersch, Dallas Fed President Robert Kaplan, Cleveland Fed President Loretta Mester and BoE Chief Economist Andy Haldane.