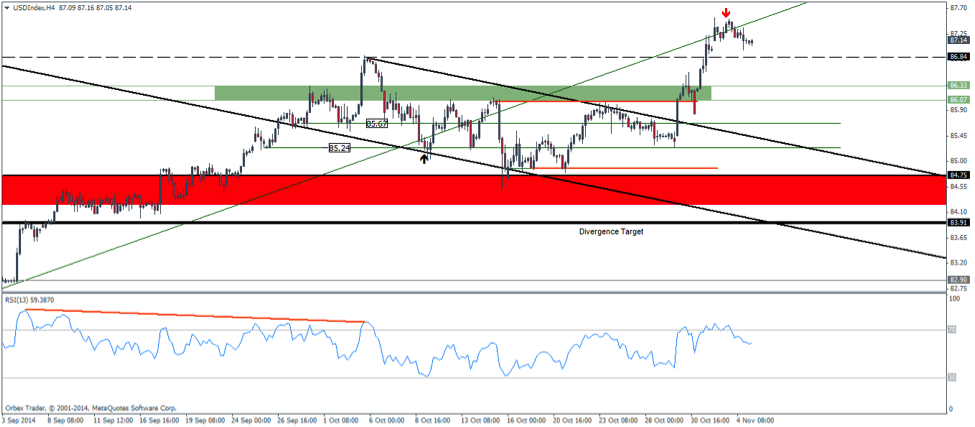
The US Dollar Index managed to survive the key FOMC event last month and continued to push higher, closing the month of October at 86.97, the highs last seen only in 2010. This region is now a multi-year resistance level with the Dollar Index failing to close above this region in the past. 88.45, 89.17 are the next key resistance levels to watch out for.
The other major headwinds to the Dollar Index is this Friday’s NFP data with the expectations already being quite bullish on the number of jobs while the markets wait for later this month to read into the Fed’s minutes which could shed more light. There has been a growing consensus that the Fed’s hawkish note at the previous FOMC event was on account of the impending senate elections in the US, with the Fed generally known for not throwing any surprises ahead of the key political events. It will therefore be a mixed bag of expectations going into the Fed’s minutes to see what really conspired. The fed will be releasing their meeting minutes on November 19th.
From last week’s analysis of the US Dollar Index, price managed to break out of the resistance formed near 86.07 regions but the gains were capped near a long term trend line with the most recent candlesticks showing a reversal right near the trend line, shown on the chart below. 
With resistance capping further gains for the short term, we could expect the Dollar Index to decline back to test and establish support near the previous resistance level of 86.84 – 85.73, which is the region which shows a bullish break out after a small correction to the downside.
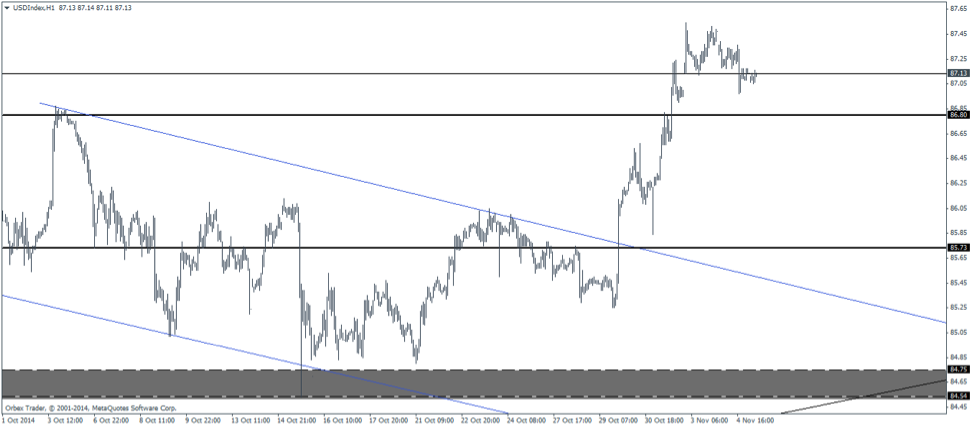
The next chart below shows the hourly time frame and as we can see, in the very short term, price looks to be heading lower to test the previous high near 86.8. Support needs to be established here for the Dollar index to rally higher. Alternatively, if the level of 86.8 gives way, we could see further declines towards the previous break out level and support at 85.73 and would put the bullish break out of the US Dollar into question ahead of the NFP event this week. 
For the very short term, the likely high event that could steer the Dollar Index would be the Non Farm payroll data that is due this Friday. Expectations call for a 229k reading after last month saw the job numbers increase to 248k. The overall trend in the jobs report has been consistently pointing higher and this month’s reading could very well beat expectations, but the bigger question remains as to whether it can outperform last month’s numbers as well.
For the moment, the Dollar Index looks well poised for more gains within the very short term, however the fact that it is trading near well known multi-year resistance levels is something that should be kept in mind.
- English (UK)
- English (India)
- English (Canada)
- English (Australia)
- English (South Africa)
- English (Philippines)
- English (Nigeria)
- Deutsch
- Español (España)
- Español (México)
- Français
- Italiano
- Nederlands
- Português (Portugal)
- Polski
- Português (Brasil)
- Русский
- Türkçe
- العربية
- Ελληνικά
- Svenska
- Suomi
- עברית
- 日本語
- 한국어
- 简体中文
- 繁體中文
- Bahasa Indonesia
- Bahasa Melayu
- ไทย
- Tiếng Việt
- हिंदी
US Dollar Index Weekly Analysis, 05/11
Published 11/05/2014, 02:15 AM
Updated 08/29/2019, 07:20 AM
US Dollar Index Weekly Analysis, 05/11

ORBEX
3rd party Ad. Not an offer or recommendation by Investing.com. See disclosure here or
remove ads
.
Latest comments
Install Our App
Risk Disclosure: Trading in financial instruments and/or cryptocurrencies involves high risks including the risk of losing some, or all, of your investment amount, and may not be suitable for all investors. Prices of cryptocurrencies are extremely volatile and may be affected by external factors such as financial, regulatory or political events. Trading on margin increases the financial risks.
Before deciding to trade in financial instrument or cryptocurrencies you should be fully informed of the risks and costs associated with trading the financial markets, carefully consider your investment objectives, level of experience, and risk appetite, and seek professional advice where needed.
Fusion Media would like to remind you that the data contained in this website is not necessarily real-time nor accurate. The data and prices on the website are not necessarily provided by any market or exchange, but may be provided by market makers, and so prices may not be accurate and may differ from the actual price at any given market, meaning prices are indicative and not appropriate for trading purposes. Fusion Media and any provider of the data contained in this website will not accept liability for any loss or damage as a result of your trading, or your reliance on the information contained within this website.
It is prohibited to use, store, reproduce, display, modify, transmit or distribute the data contained in this website without the explicit prior written permission of Fusion Media and/or the data provider. All intellectual property rights are reserved by the providers and/or the exchange providing the data contained in this website.
Fusion Media may be compensated by the advertisers that appear on the website, based on your interaction with the advertisements or advertisers.
© 2007-2024 - Fusion Media Limited. All Rights Reserved.