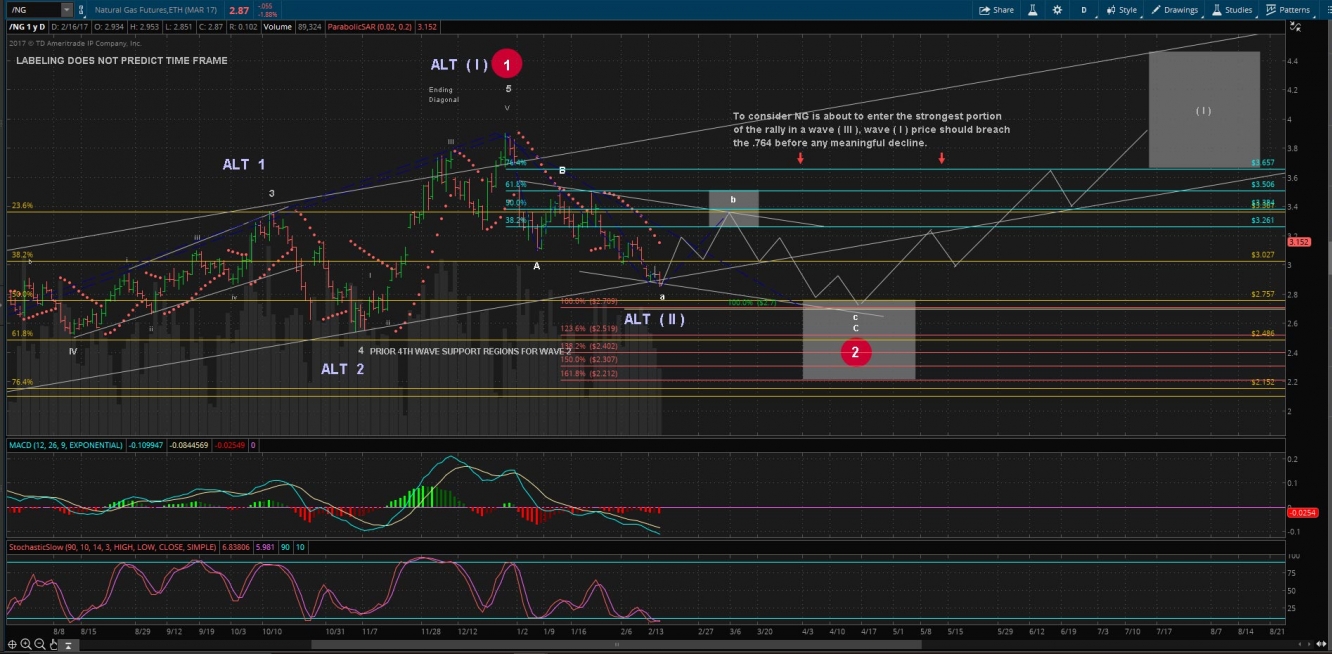
Several days ago, I posted an article on Investing.com. It detailed the potential two pathways natural gas price may take to achieve much higher levels. Today, and with a high degree of certainty, we can label one of those pathways now as a low probable “Alternative, or ALT” outcome.
(Side note: High degree of certainty does not mean guaranteed. As you can probably imagine, we receive many messages regarding the analysis we share. As many times as you remind those who follow your work that Elliott Wave deals in probabilities, not certainties, traders still want absolutes. I will apologize in advance, as I cannot provide that. )
So, with a high degree of certainty, we can consider the previously labeled dotted white line pathway as an alternative (no longer our preferred or Primary outcome).
Reasoning
Based on guidelines in the proper application of R. N. Elliott’s “Wave Principle”, as clearly pointed out by Robert Prechter in his 1978 book, “The Elliott Wave Principle”, a corrective wave 2 or (II) count becomes less probable when price breaches the .764 Fibonacci retracement level of the previous wave 1 or (I). The dotted white line represented a wave (I-II) count. That count became far less likely when priced breached the $2.866 level as it did today. We will continue to follow that count, but since less likely, it becomes our purple ALT count.
Conclusion
Having determined the white dotted line pathway as low probability, we will now track the higher probability pathway, which is the white solid line.
This pathway concludes that the recent swing high of $3.902 on the continuous contract was a “Red Circle” wave 1 high; “Red Circle” Wave 2 retracement areas are depicted on the attached chart and reside in the range of $2.70 with a maximum allowed extension to $2.212. Below the $2.212 level price begins to encroach on wave ( I ) territory of the previous rally and loses its impulsive nature. Elliott Wave provides specific guidelines in which we can expect a wave 2 bottom and that is in the area of the previous wave IV or 4 of the wave 1 impulsive.
That area is squarely between $2.45 and $2.55.
Summary
It is our opinion that a potentially longer consolidation period will ensue and we recommend natural gas swing traders acquire long term positions between the $2.45 and $2.70 area. Shorter term buy zones are between $2.77 and $2.90, which is where price is currently trading, for a counter trend rally that affords an acceptable risk/reward opportunity into the $3.12 to $3.40 area.

